

Reference — lookup information.
Getting started with the Team Activity template
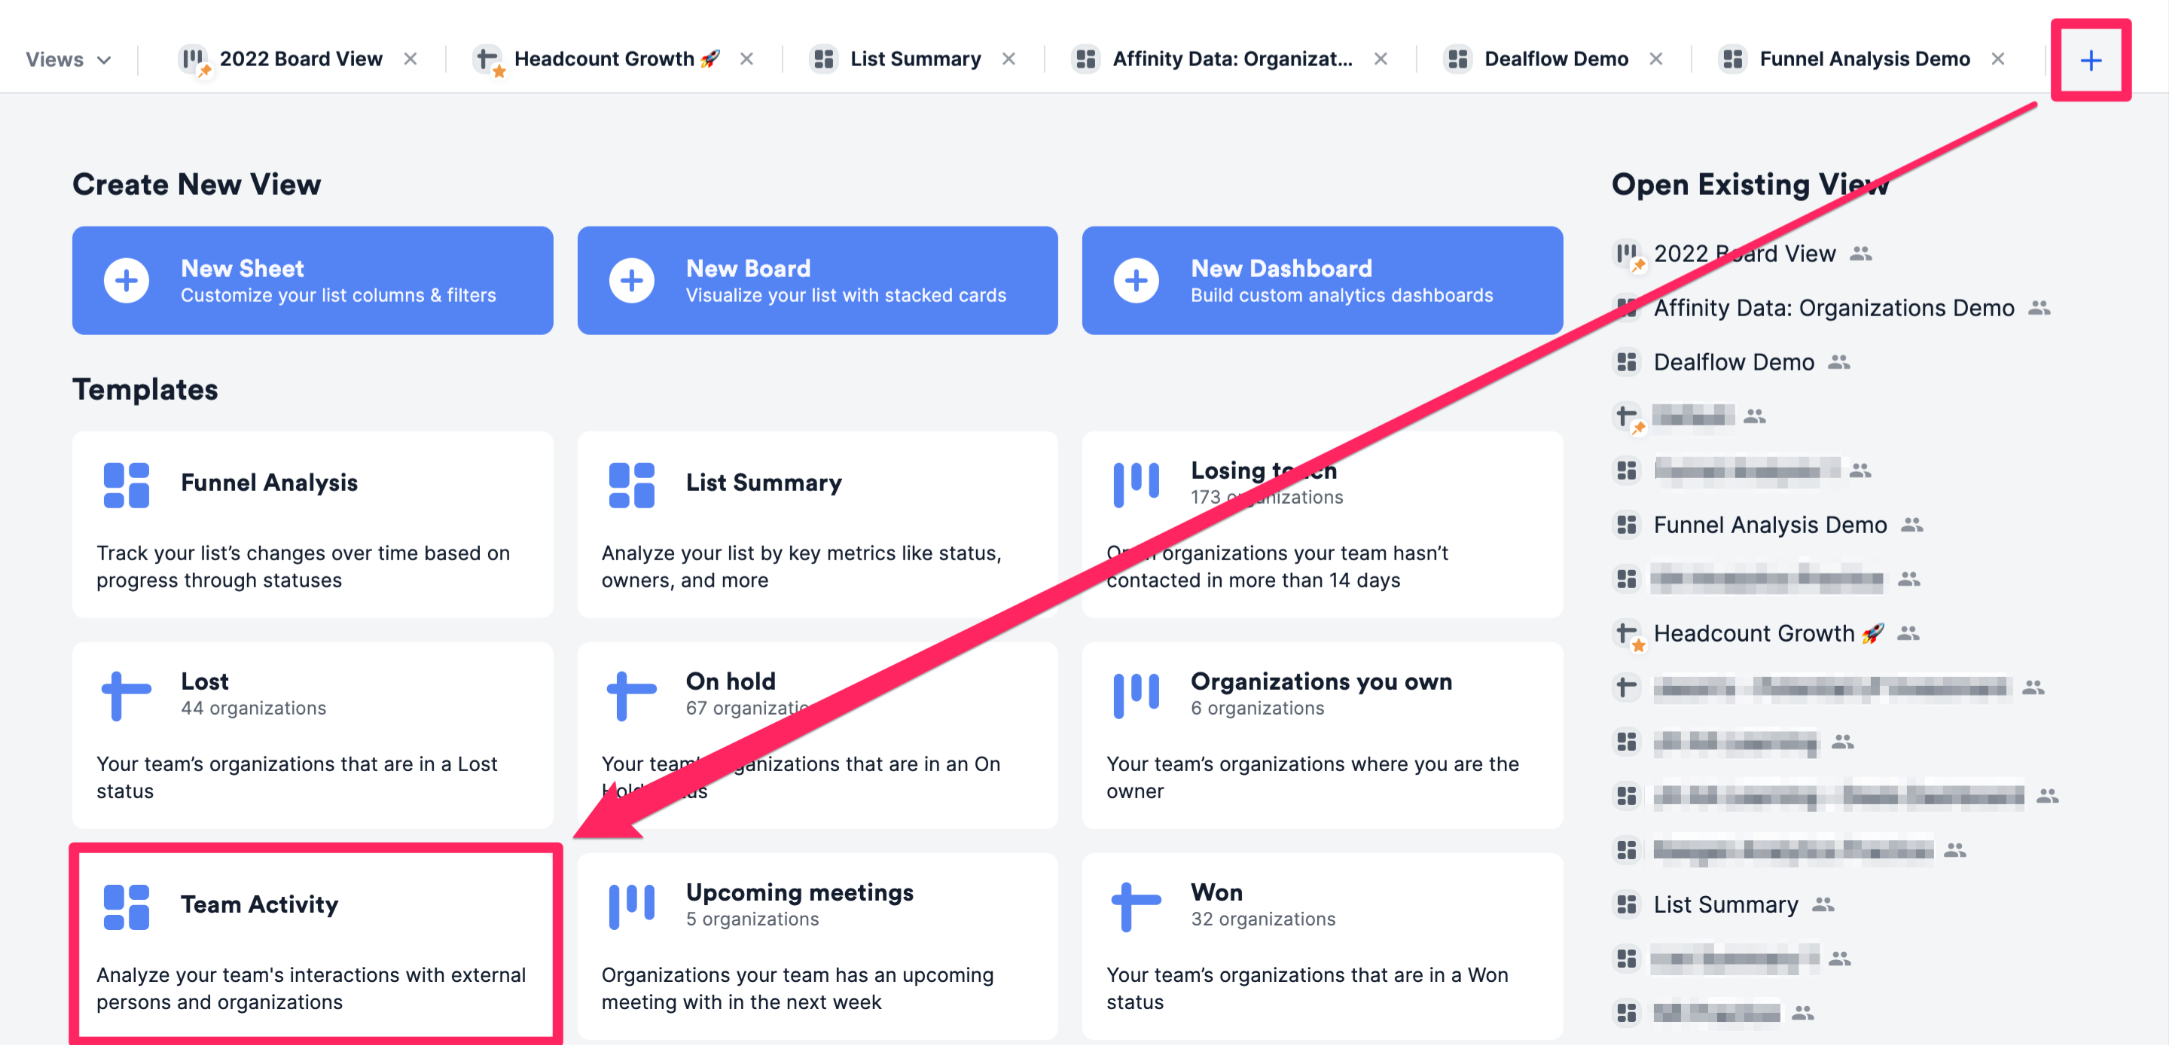
To get started, you can use the Team Activity template provided by Affinity:- First, click into the list you’d like to report on, then click the + icon as shown below. Then, click the Team Activity template option to create a new dashboard view.
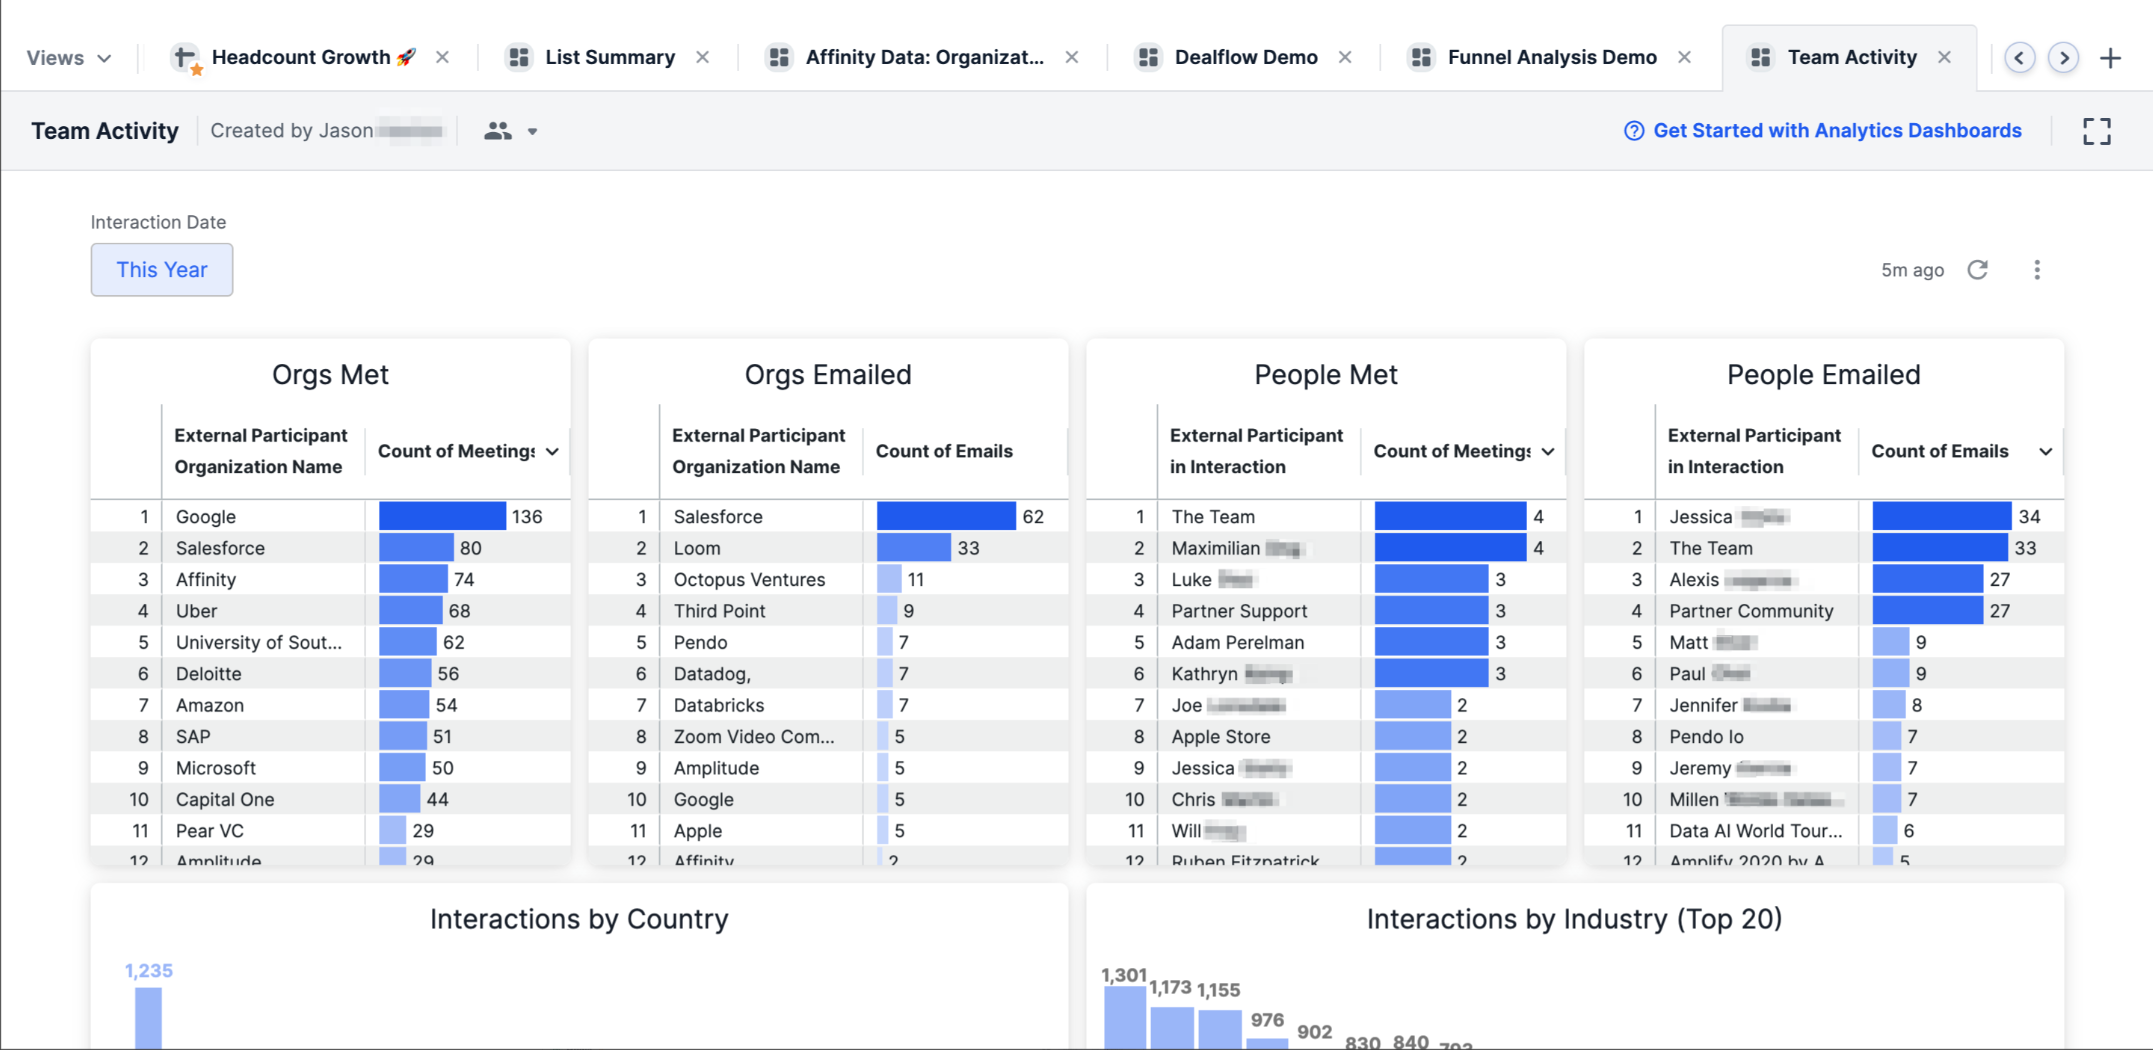
- Once the Team Activity report is generated, you will immediately see different visualization tiles and metrics based on the data within this list - these include synced emails, synced meetings, and logged interactions.
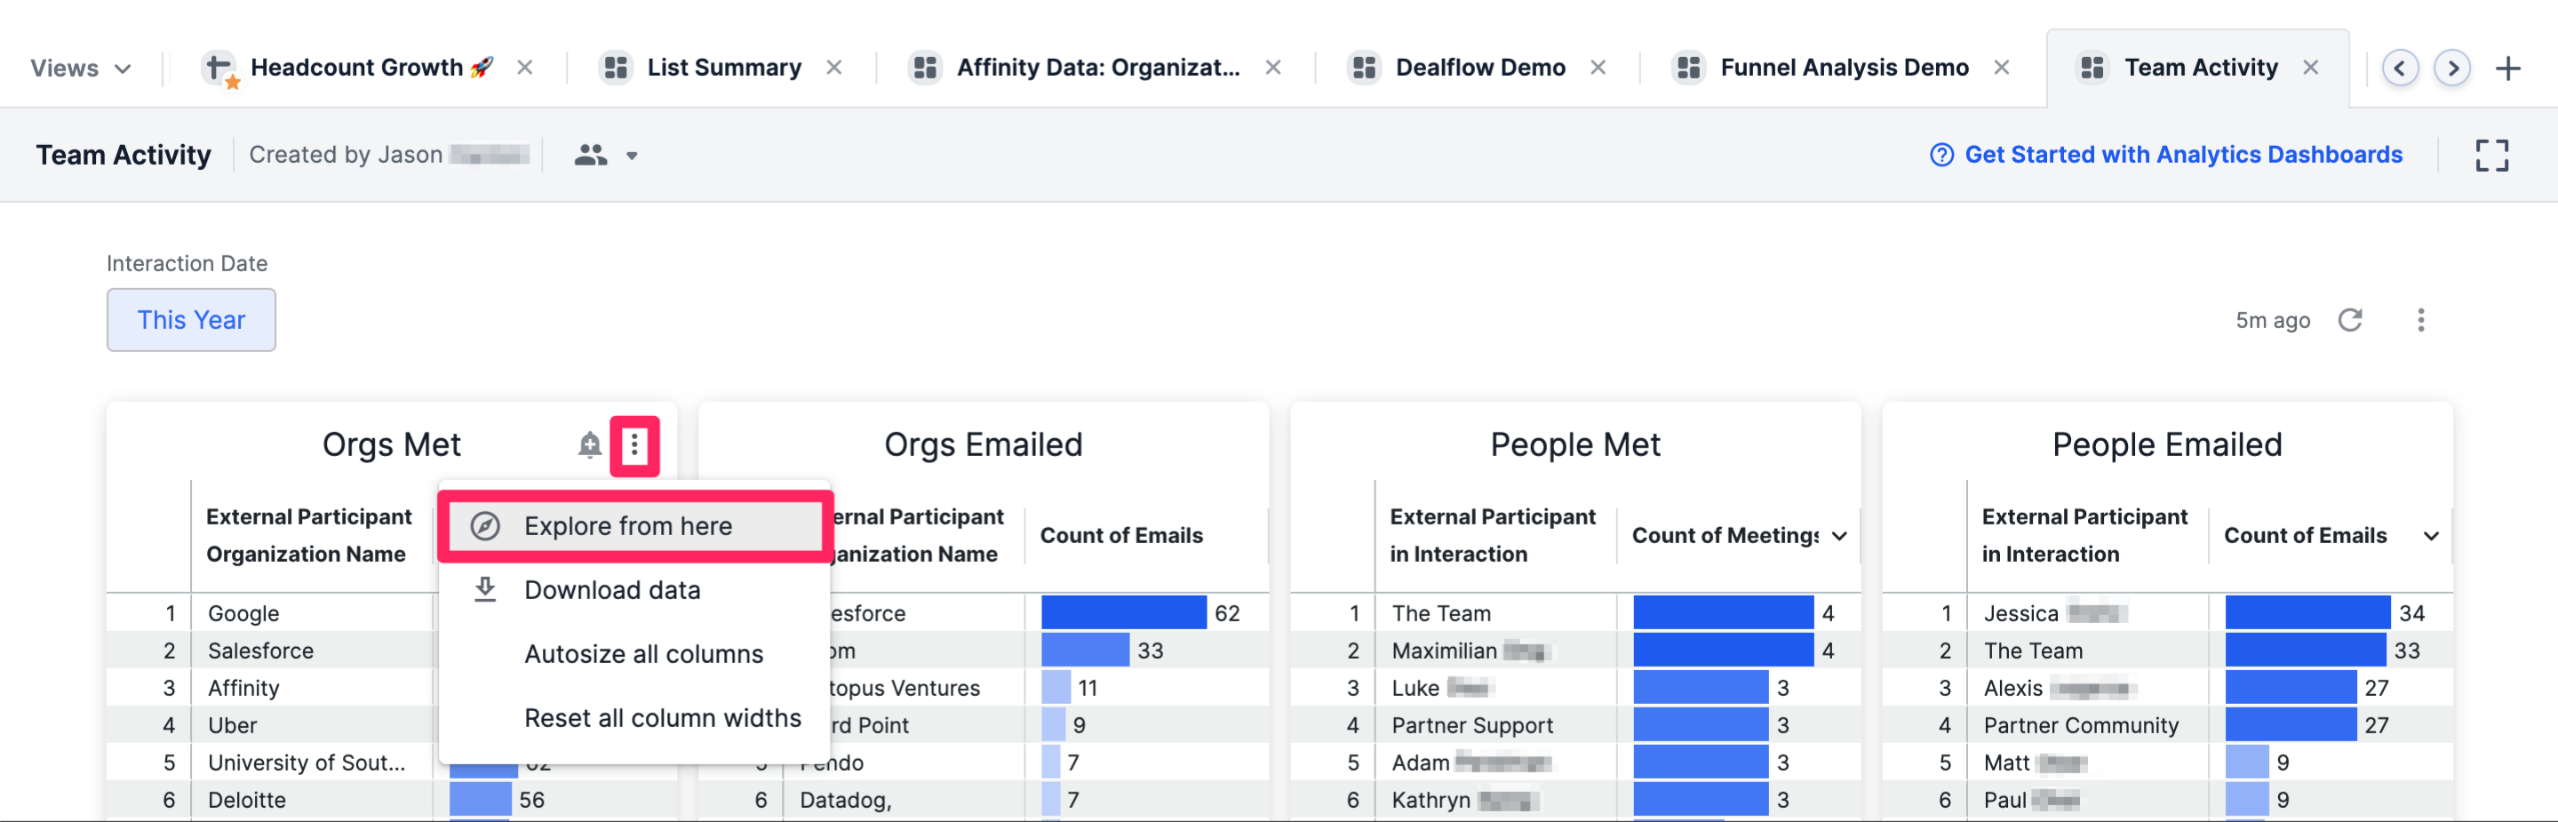
- Want to understand how certain visualization tiles were generated? Click the ellipsis (3-dotted icon) on the top-right corner of the visualization tile you want to dig deeper into, then click Explore from here.
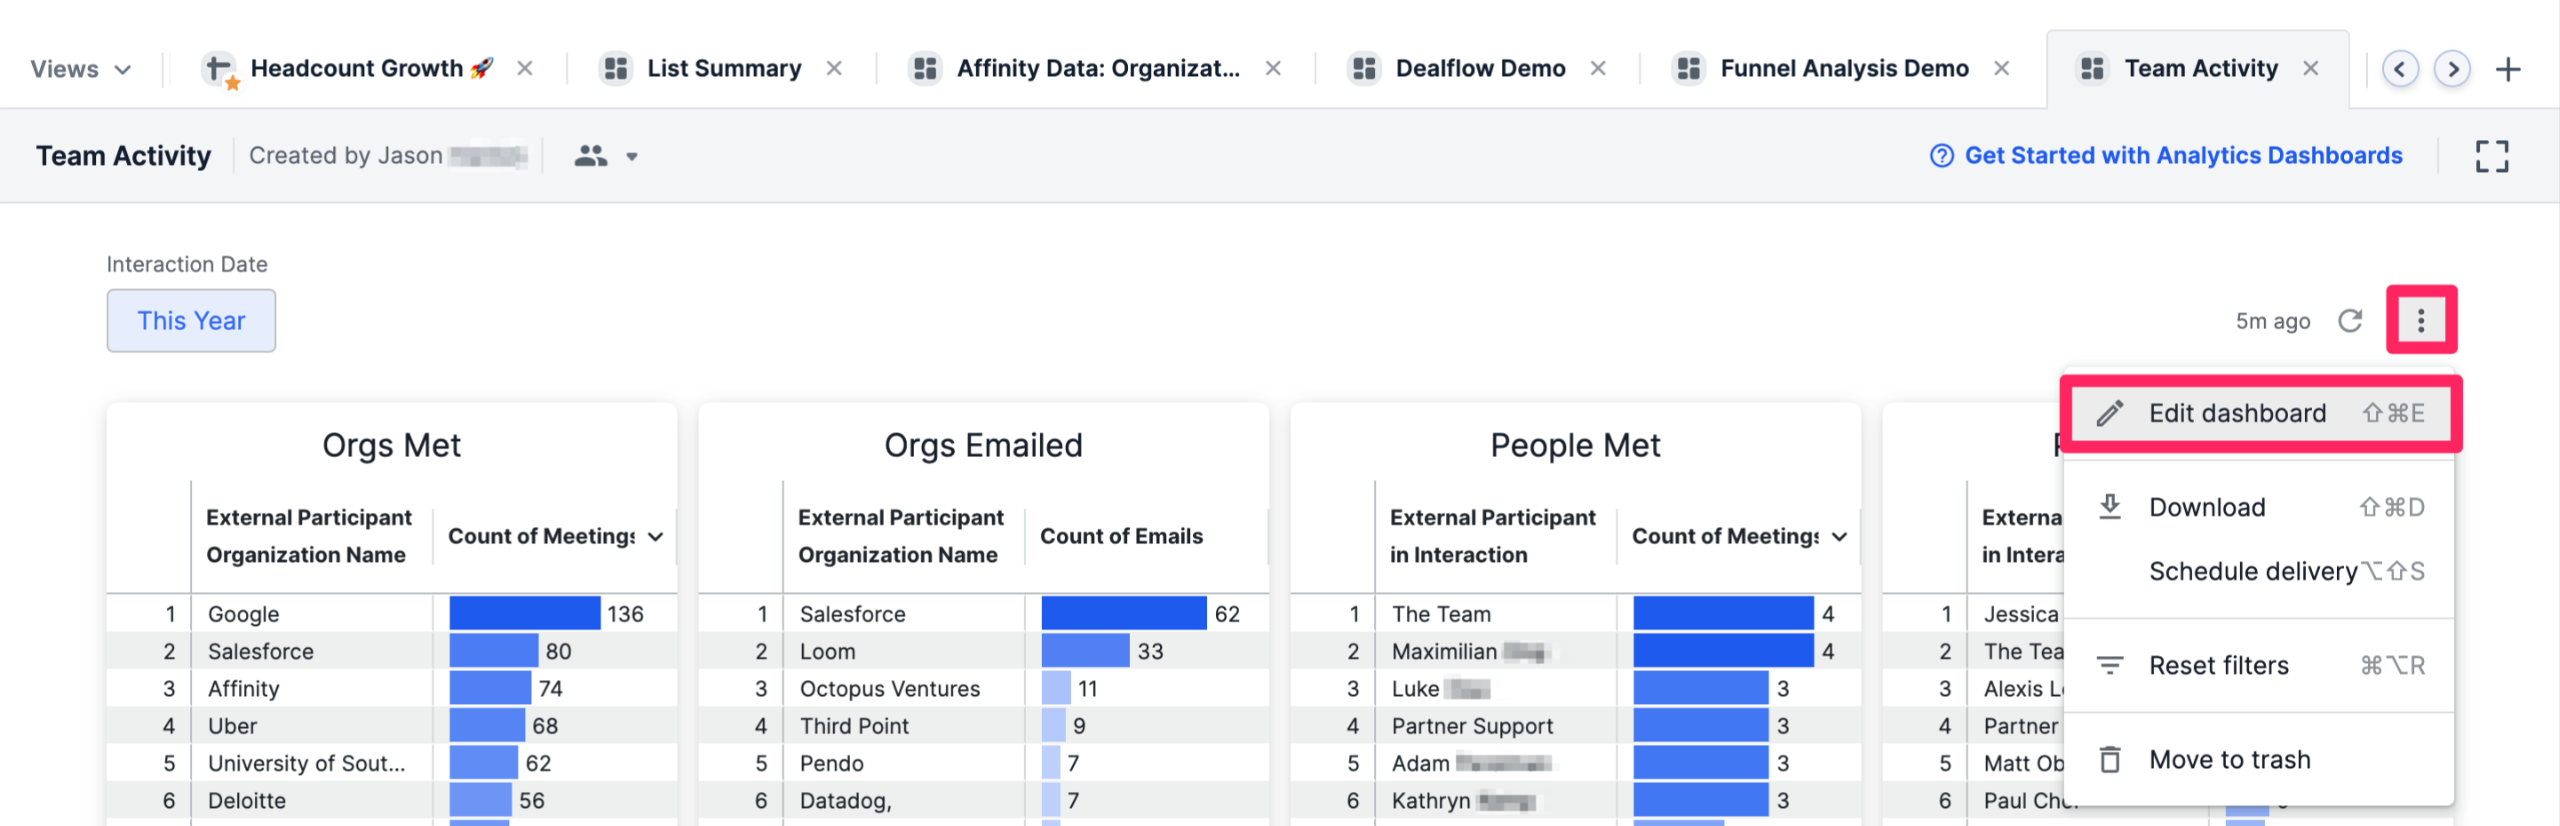
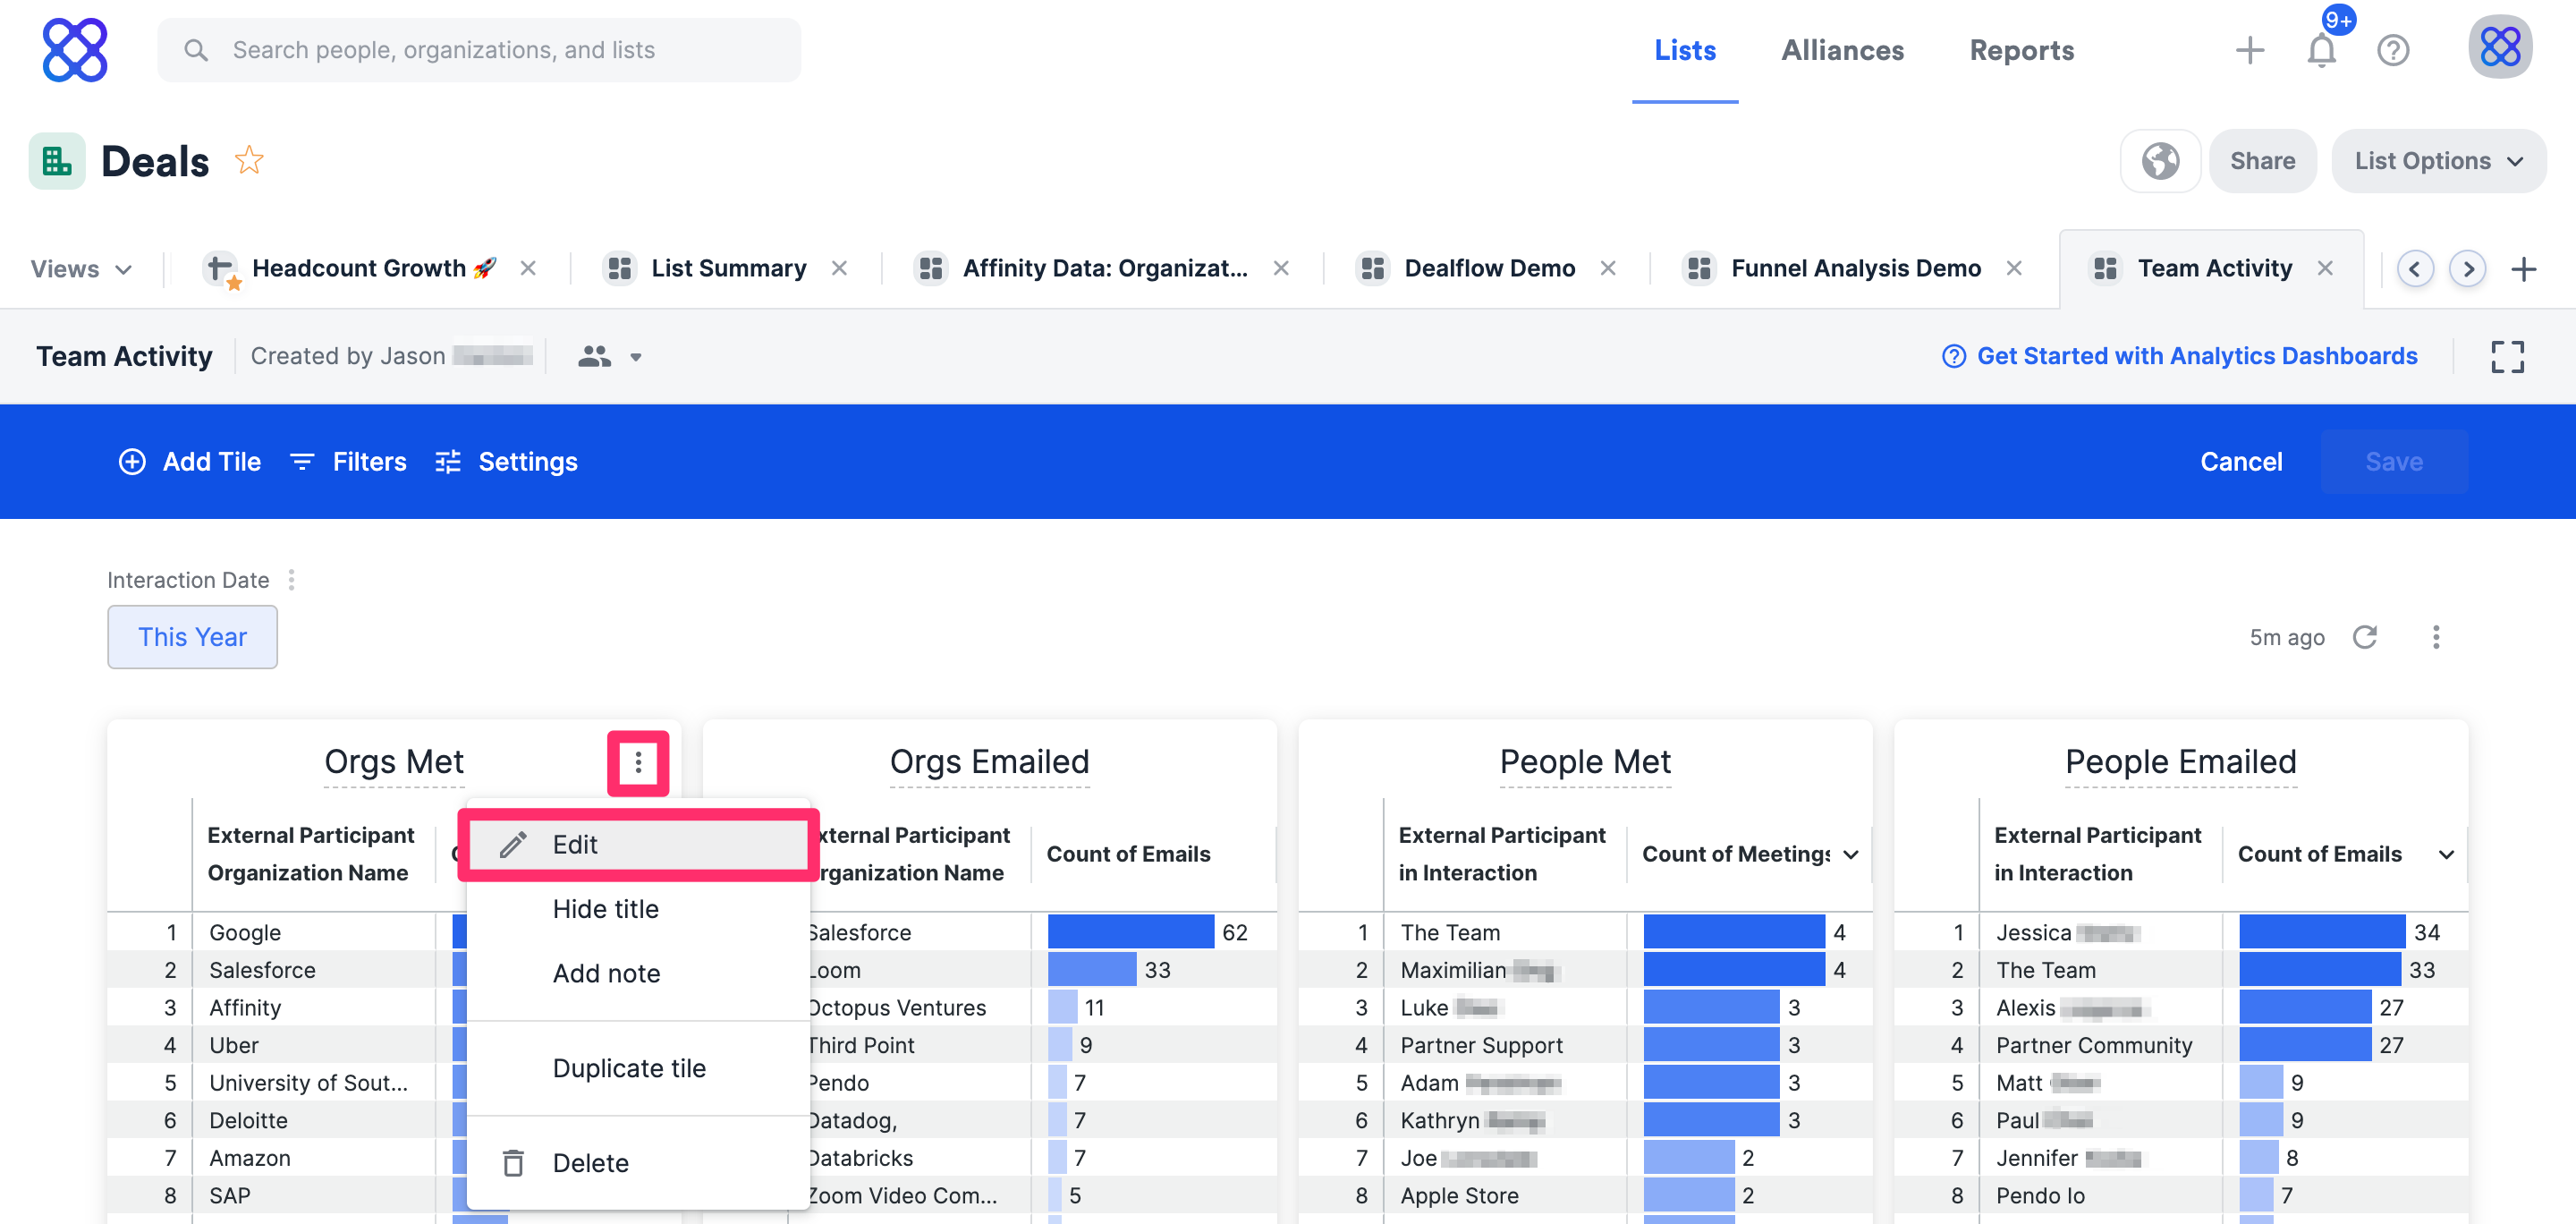
- If you’d like to change the data fields being used for certain visualization tiles, click the ellipsis (3-dotted icon) on the top-right corner, then click Edit dashboard.
- Then, click the ellipsis (3-dotted icon) on the top-right corner of the visualization tile you want to dig deeper into, then click Edit.
Important Callouts
- Reporting on Interaction Direction - You can distinguish between Inbound and Outbound emails in their Team Activity Reports when using the Interaction Direction dimension.
- Emails sent by internal contacts (your team members using Affinity) will be labeled “Outbound” while emails sent by external contacts (non-team members) will be labeled “Inbound” (see Internal vs. External Contacts).
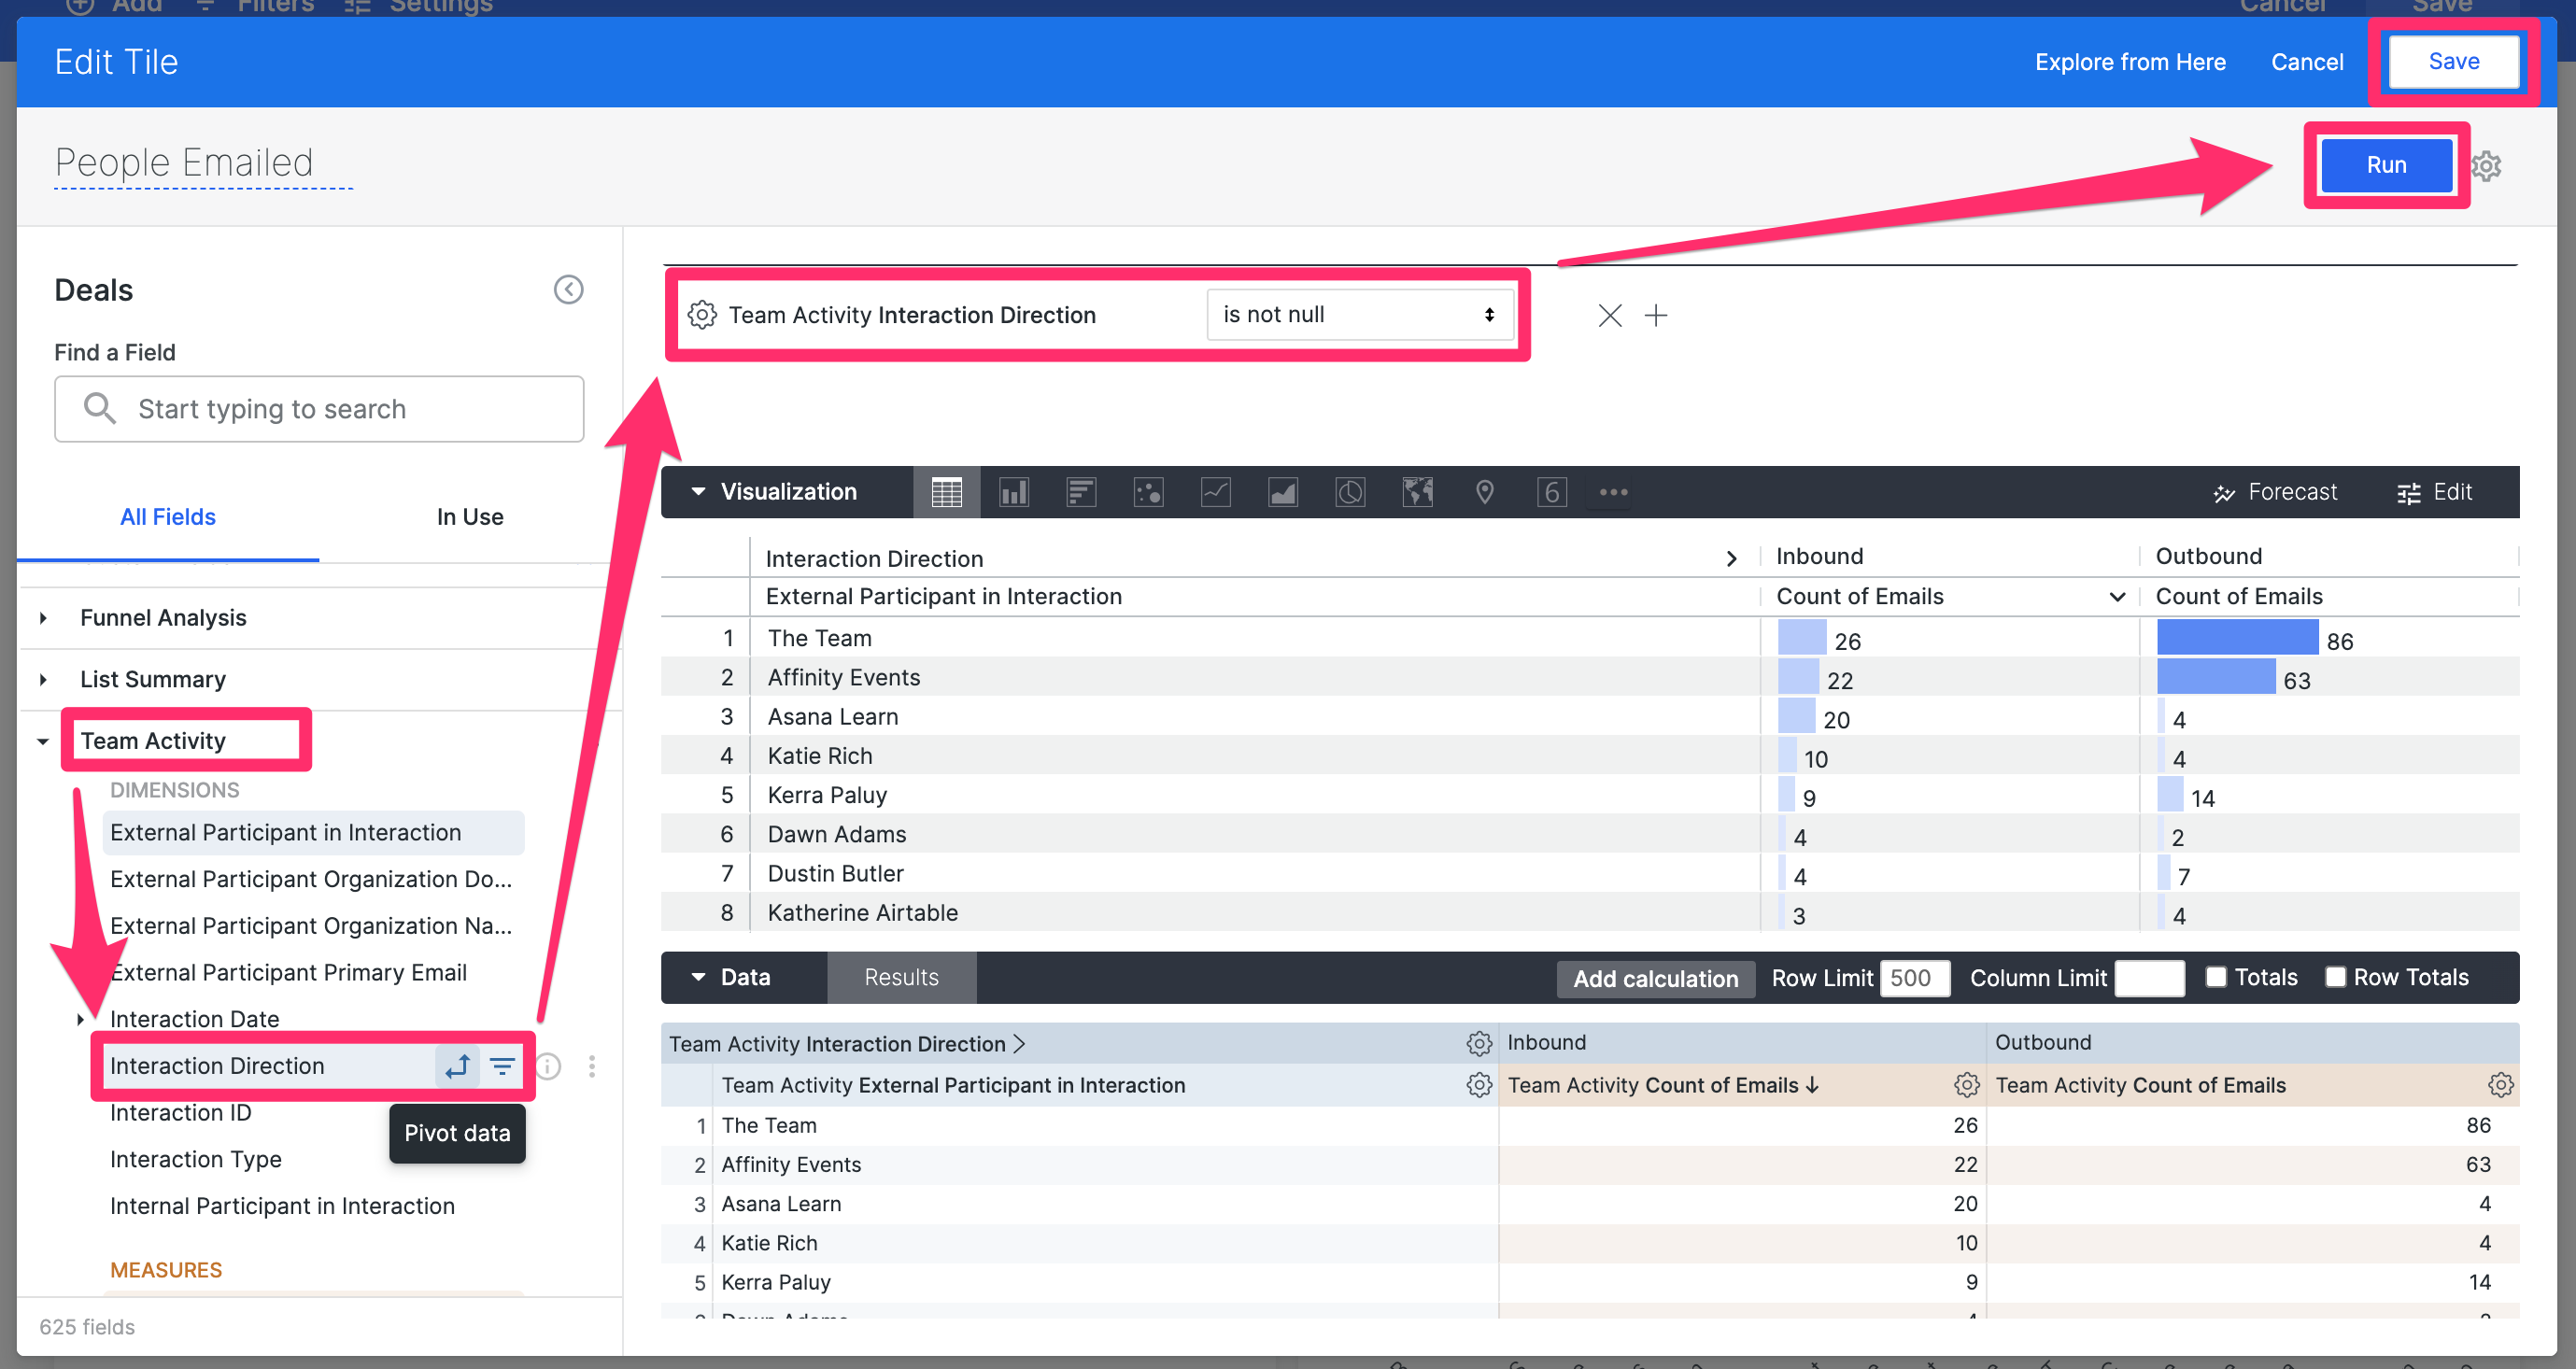
- In this example below, you can pivot by the Interaction Direction dimension to separate Inbound emails from Outbound emails, then filter out the null values.
- Future meetings in Team Activity Reports - Team Activity Reports include future meetings (up to one month from the present day) so you can take into account upcoming meetings as well.
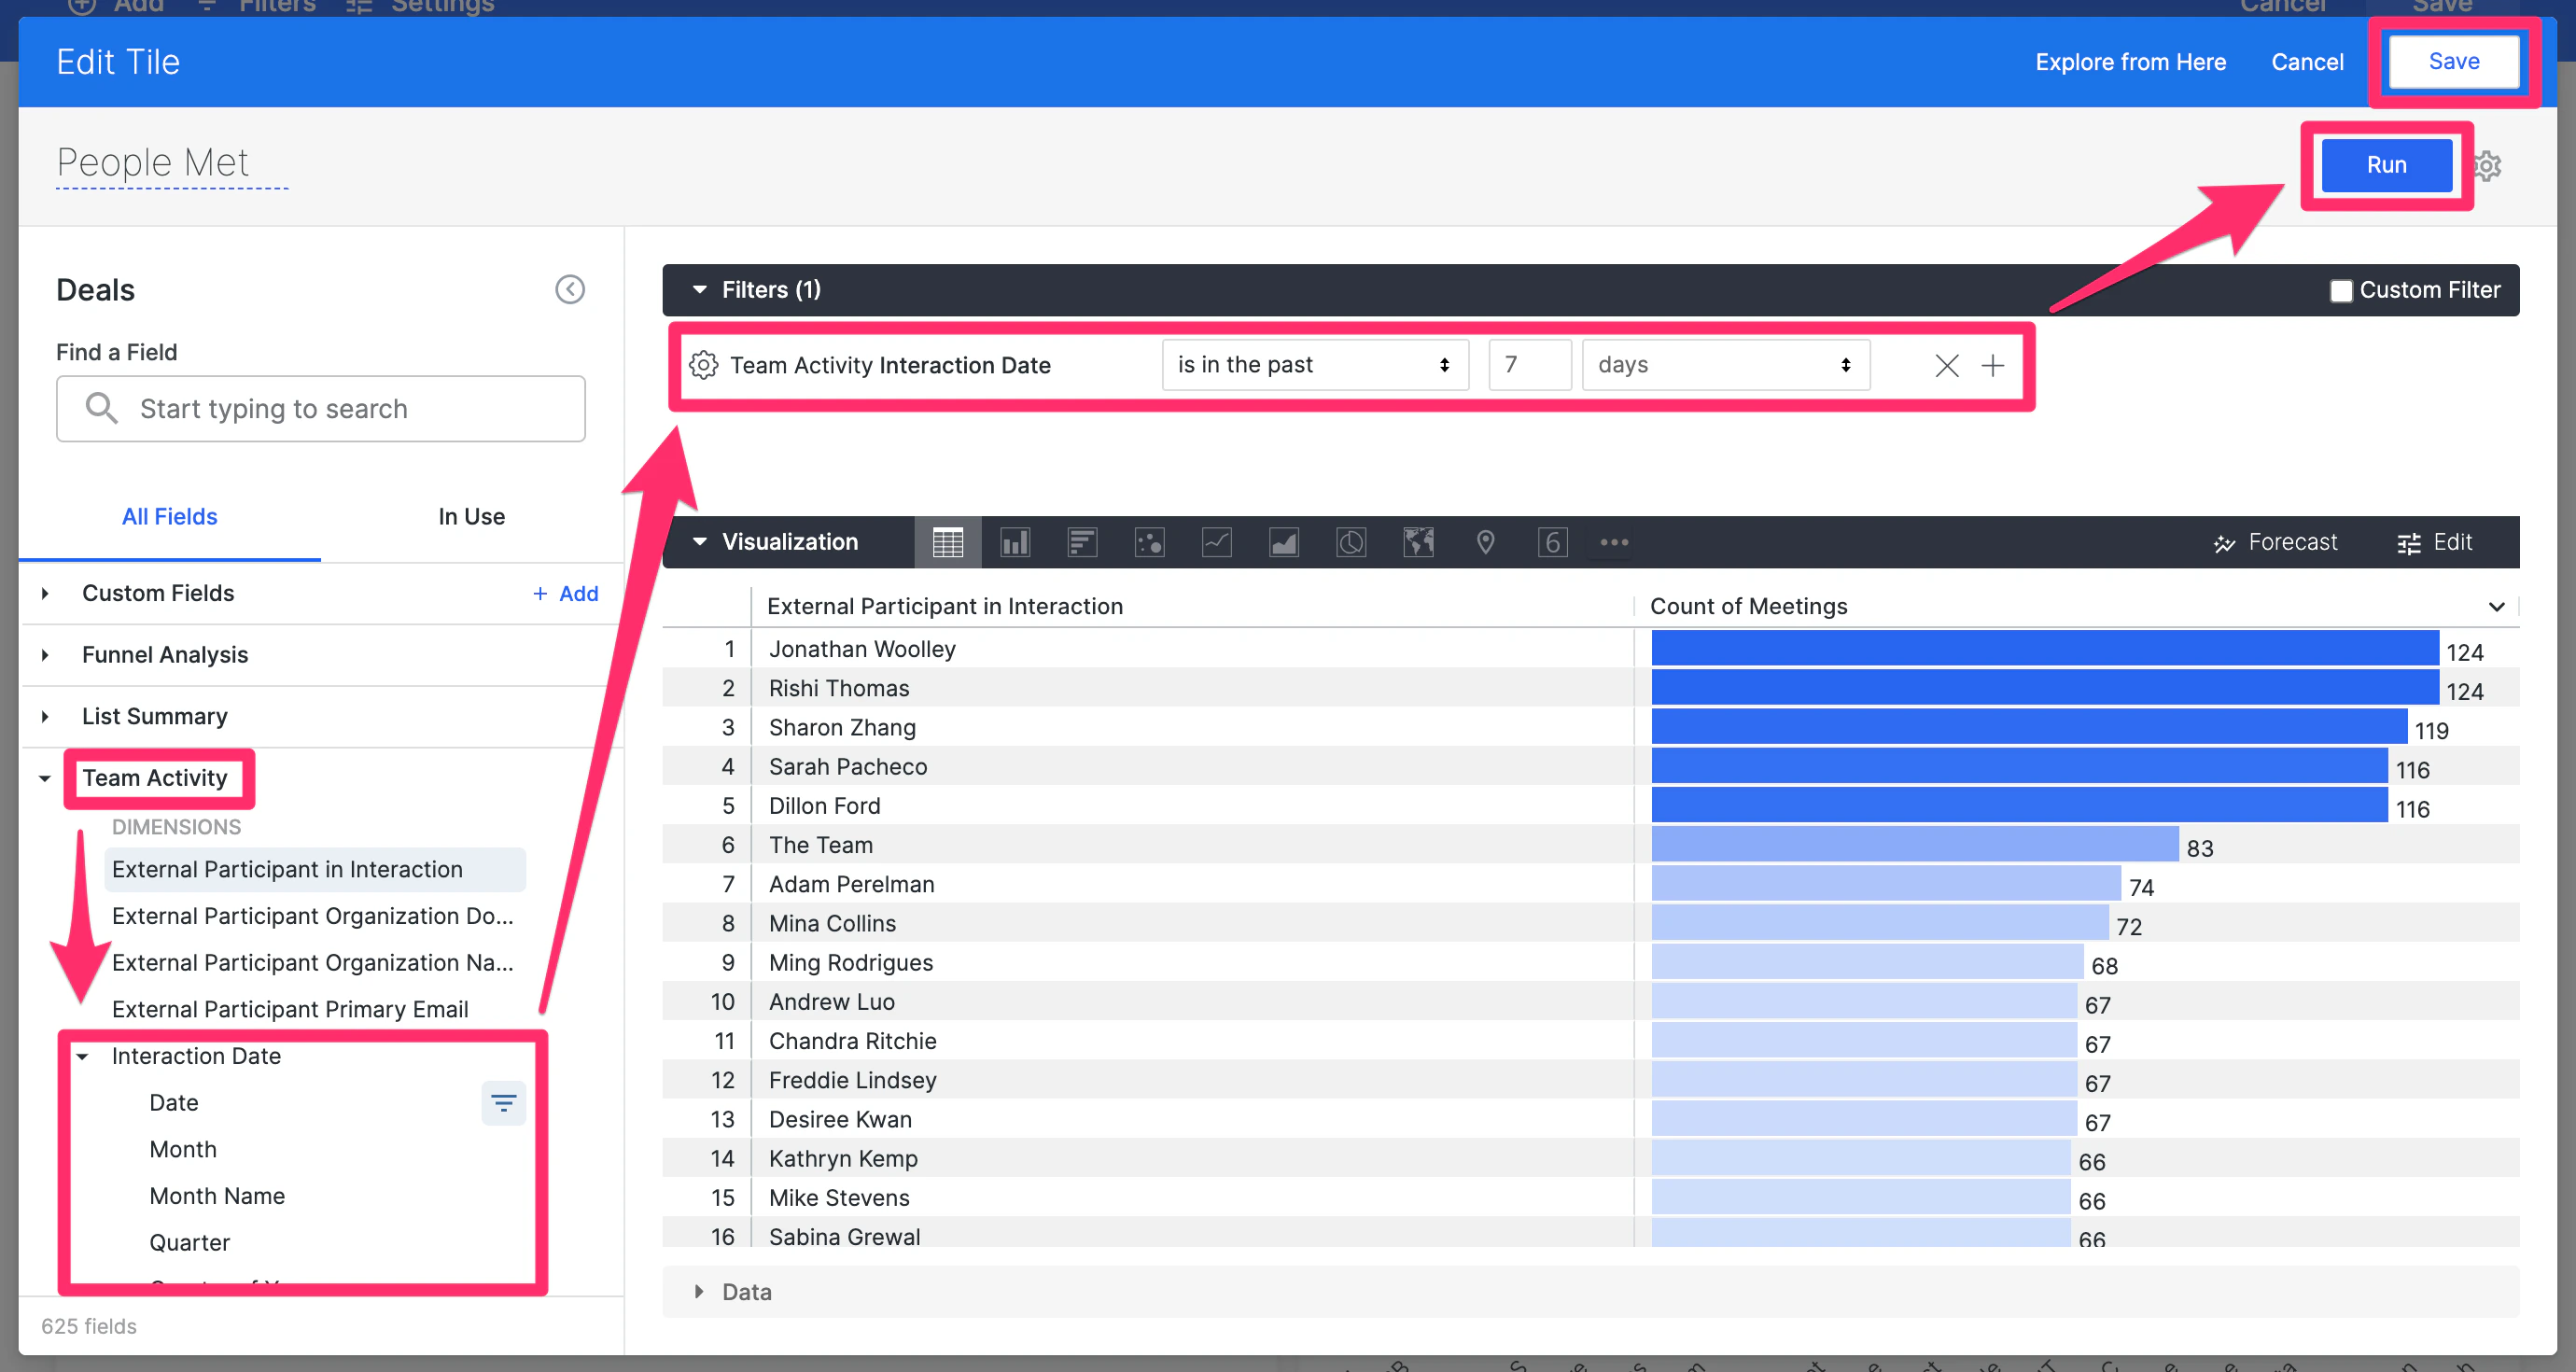
- Since this retroactively impacts existing Team Activity Reports, you can exclude future meetings from previous and/or new Team Activity Reports by filtering them out using the Interaction Date dimension (see How to apply filters in dashboard views).
- Manually Logged Interactions (Chat Message) - You can use the new “Count of Chat Messages” measure to filter your interaction counts to just the chat messages that you’ve manually added to Affinity.
- Chat Messages can be broken down further by the new “Direction” dimension, which enables you to filter your chat messages by Sent vs. Received.