Concept — background and overview.
- Summary Reports
- Funnel Analysis Reports
- Team Activity Reports
- Forecast Reports
- Performance Reports
- Opportunities Reports
Who can access Basic Reporting?
Please note that Basic Reporting is a legacy feature that is no longer available for new customers. If you don’t see the Reports tab on the global navigation bar on the left side of your screen, it is most likely that you are on one of the new tiers below:- For those on the Scale, Advanced, and Enterprise tiers, you can leverage advanced reporting features with Affinity Analytics.
- For those on the Essential tier, we highly suggest upgrading to the Scale, Advanced, or Enterprise tiers to leverage Affinity Analytics.
How to leverage Affinity’s Basic Reporting
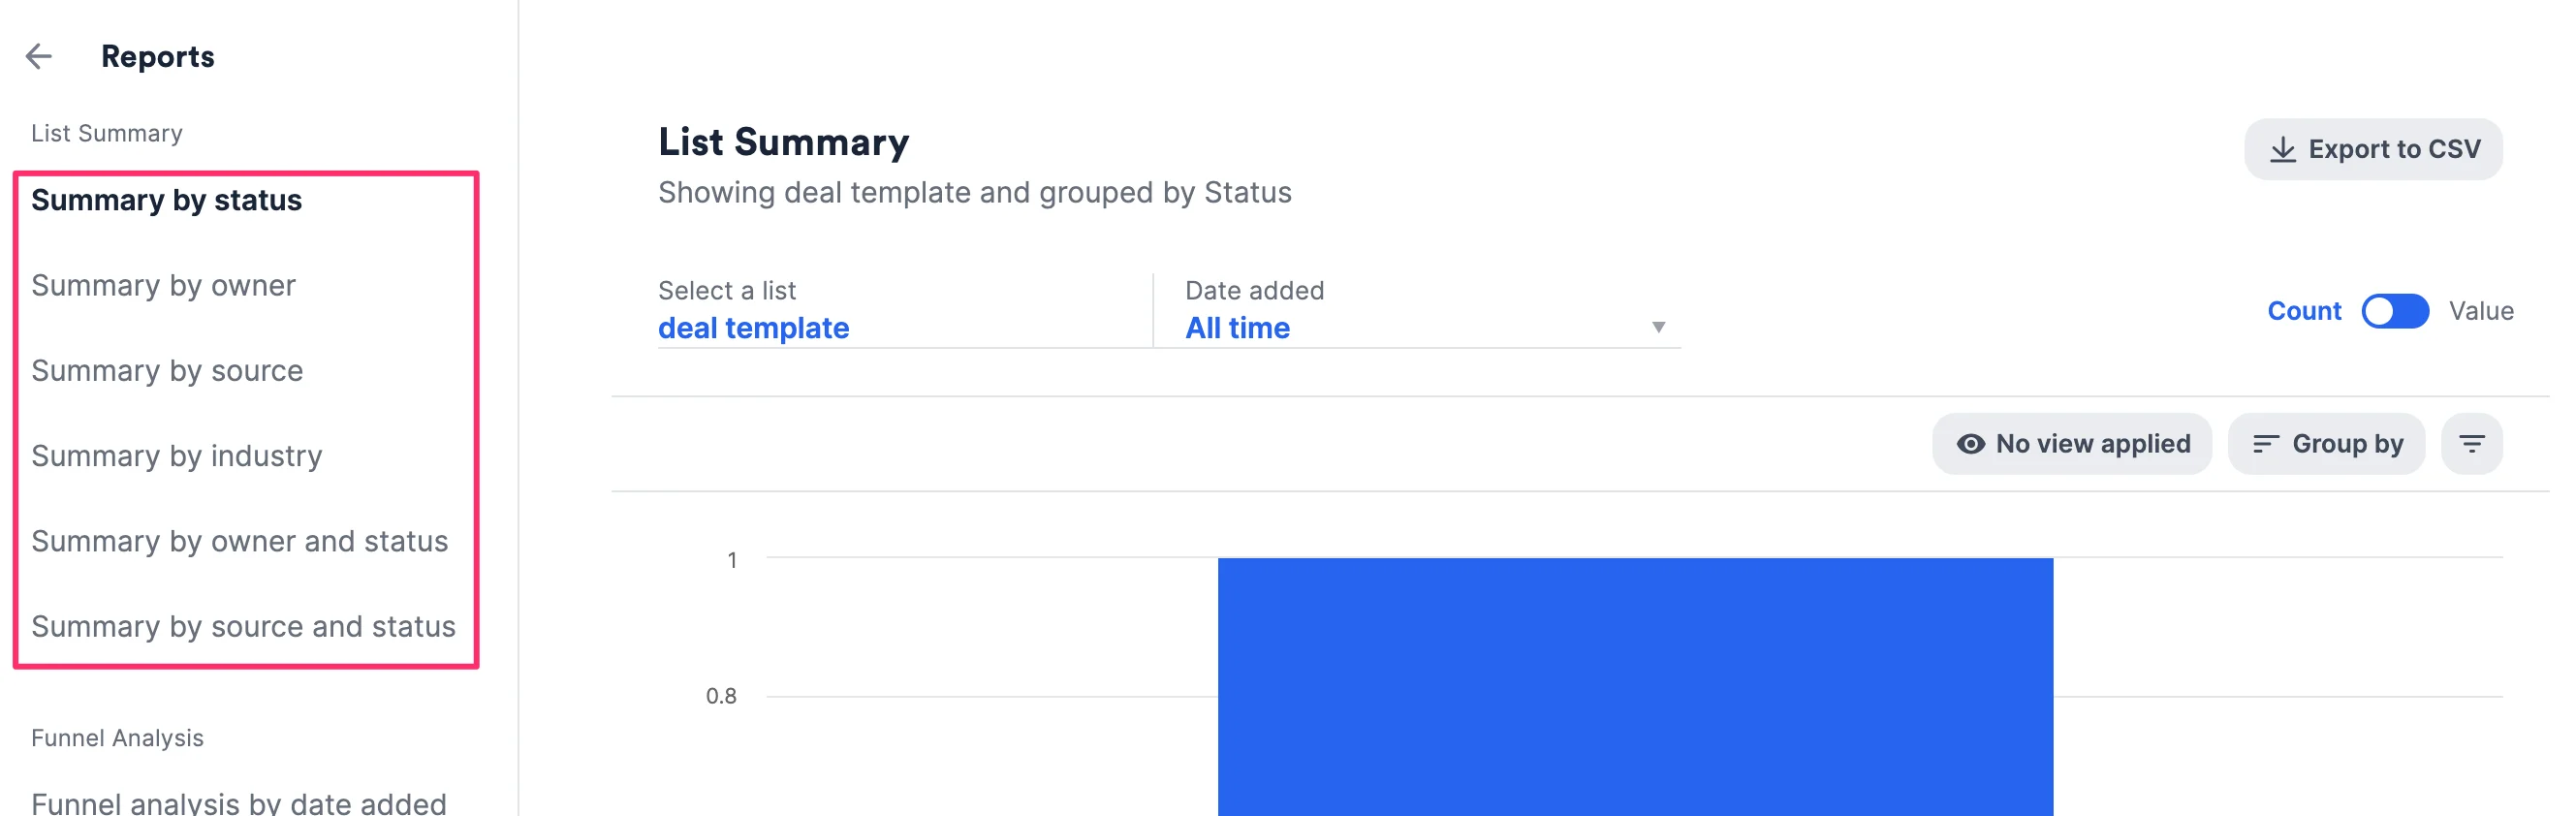
- Click Reports on the left side of your global navigation bar.

- Choose one of the predetermined report options.
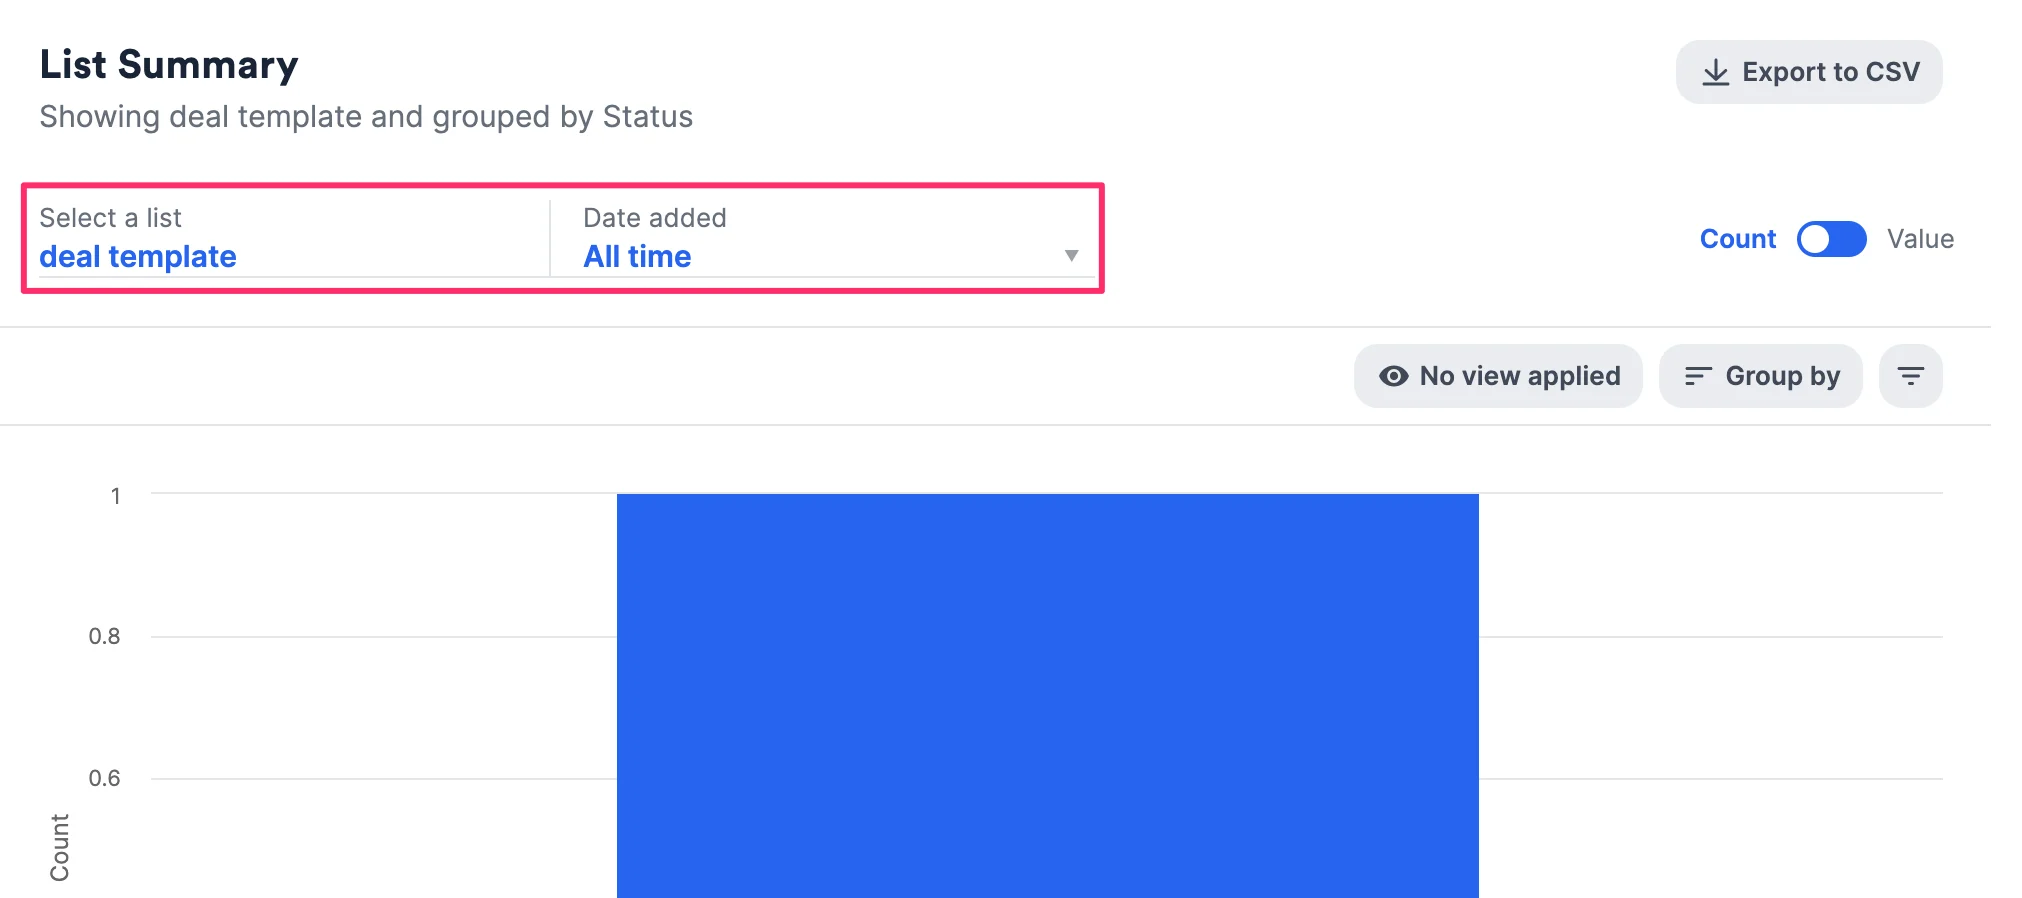
- Then, select a list and a date range.
- Narrow down relevant information by choosing a saved view with preset filters, grouping by a certain field, or by filtering from scratch.
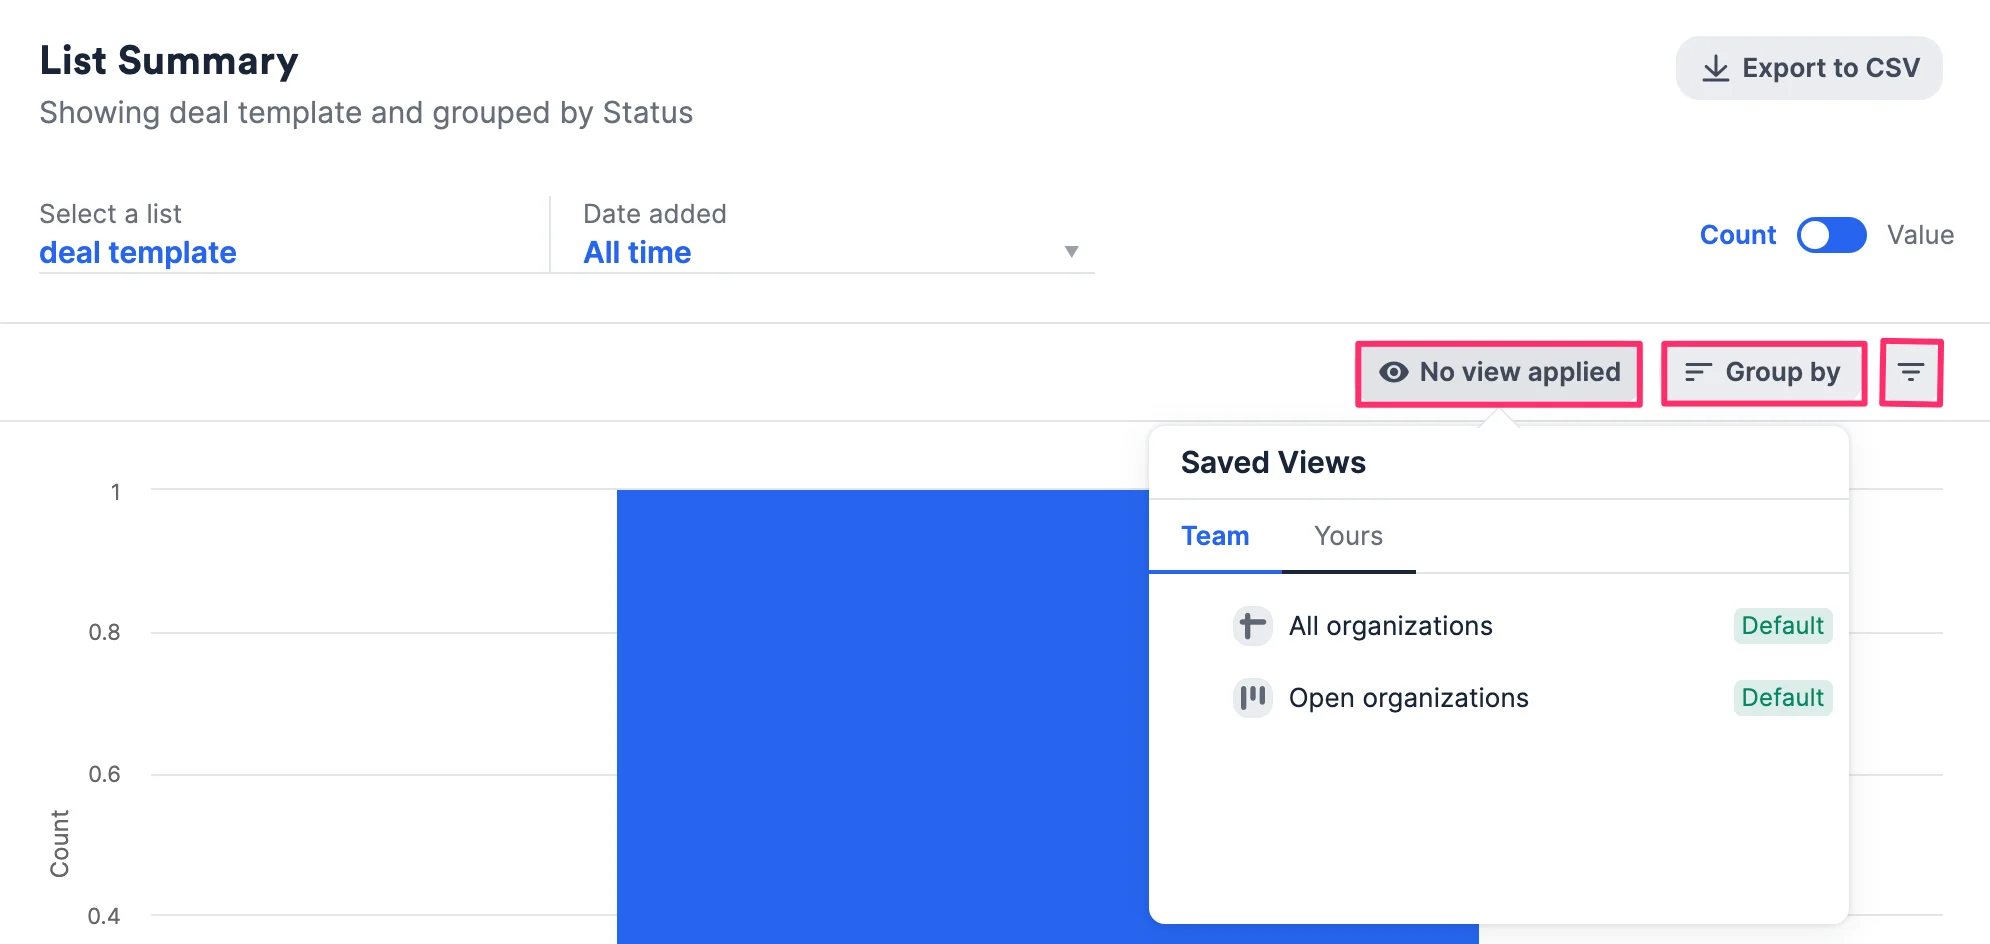
- You can group by a maximum of two fields to perform further analysis.
- The first grouping will indicate the groups on the x-axis.
- The second grouping will indicate the groups within each group on the x-axis.
Note: If you’re grouping by any Crunchbase fields, the Export to CSV button will be disabled (see Limitations on Affinity’s Basic Reporting).
- To learn more about the different templates, click one of the following articles below:
Limitations on Affinity’s Basic Reporting
- Per our contract with Crunchbase, the Export to CSV button will be disabled if your report is grouping by any Crunchbase fields (see Crunchbase data in Affinity).
- Some reports support a maximum of 12 filters that are chosen based on which tags contain the most data - if the intended tags don’t show, you can always edit the tags you’d like to see. (i.e. Summary by owner chooses 12 owners ranked from highest to lowest based on the number of entries they own).
- Reports that support a maximum of 12 filters are:
- Summary by owner
- Summary by source
- Summary by industry
- Reports that support a maximum of 12 filters are: