Advanced — power-user technique.
Definitions to know
- Dimensions - The existing fields in your lists (e.g. Status, Owners, Amount, Location, etc.).
- Measures - The units of measurement for these existing fields (e.g. Count, Average, etc.)
- Table Calculations - Completely new fields generated from your existing fields.
How to create custom dimensions, measures, and calculations
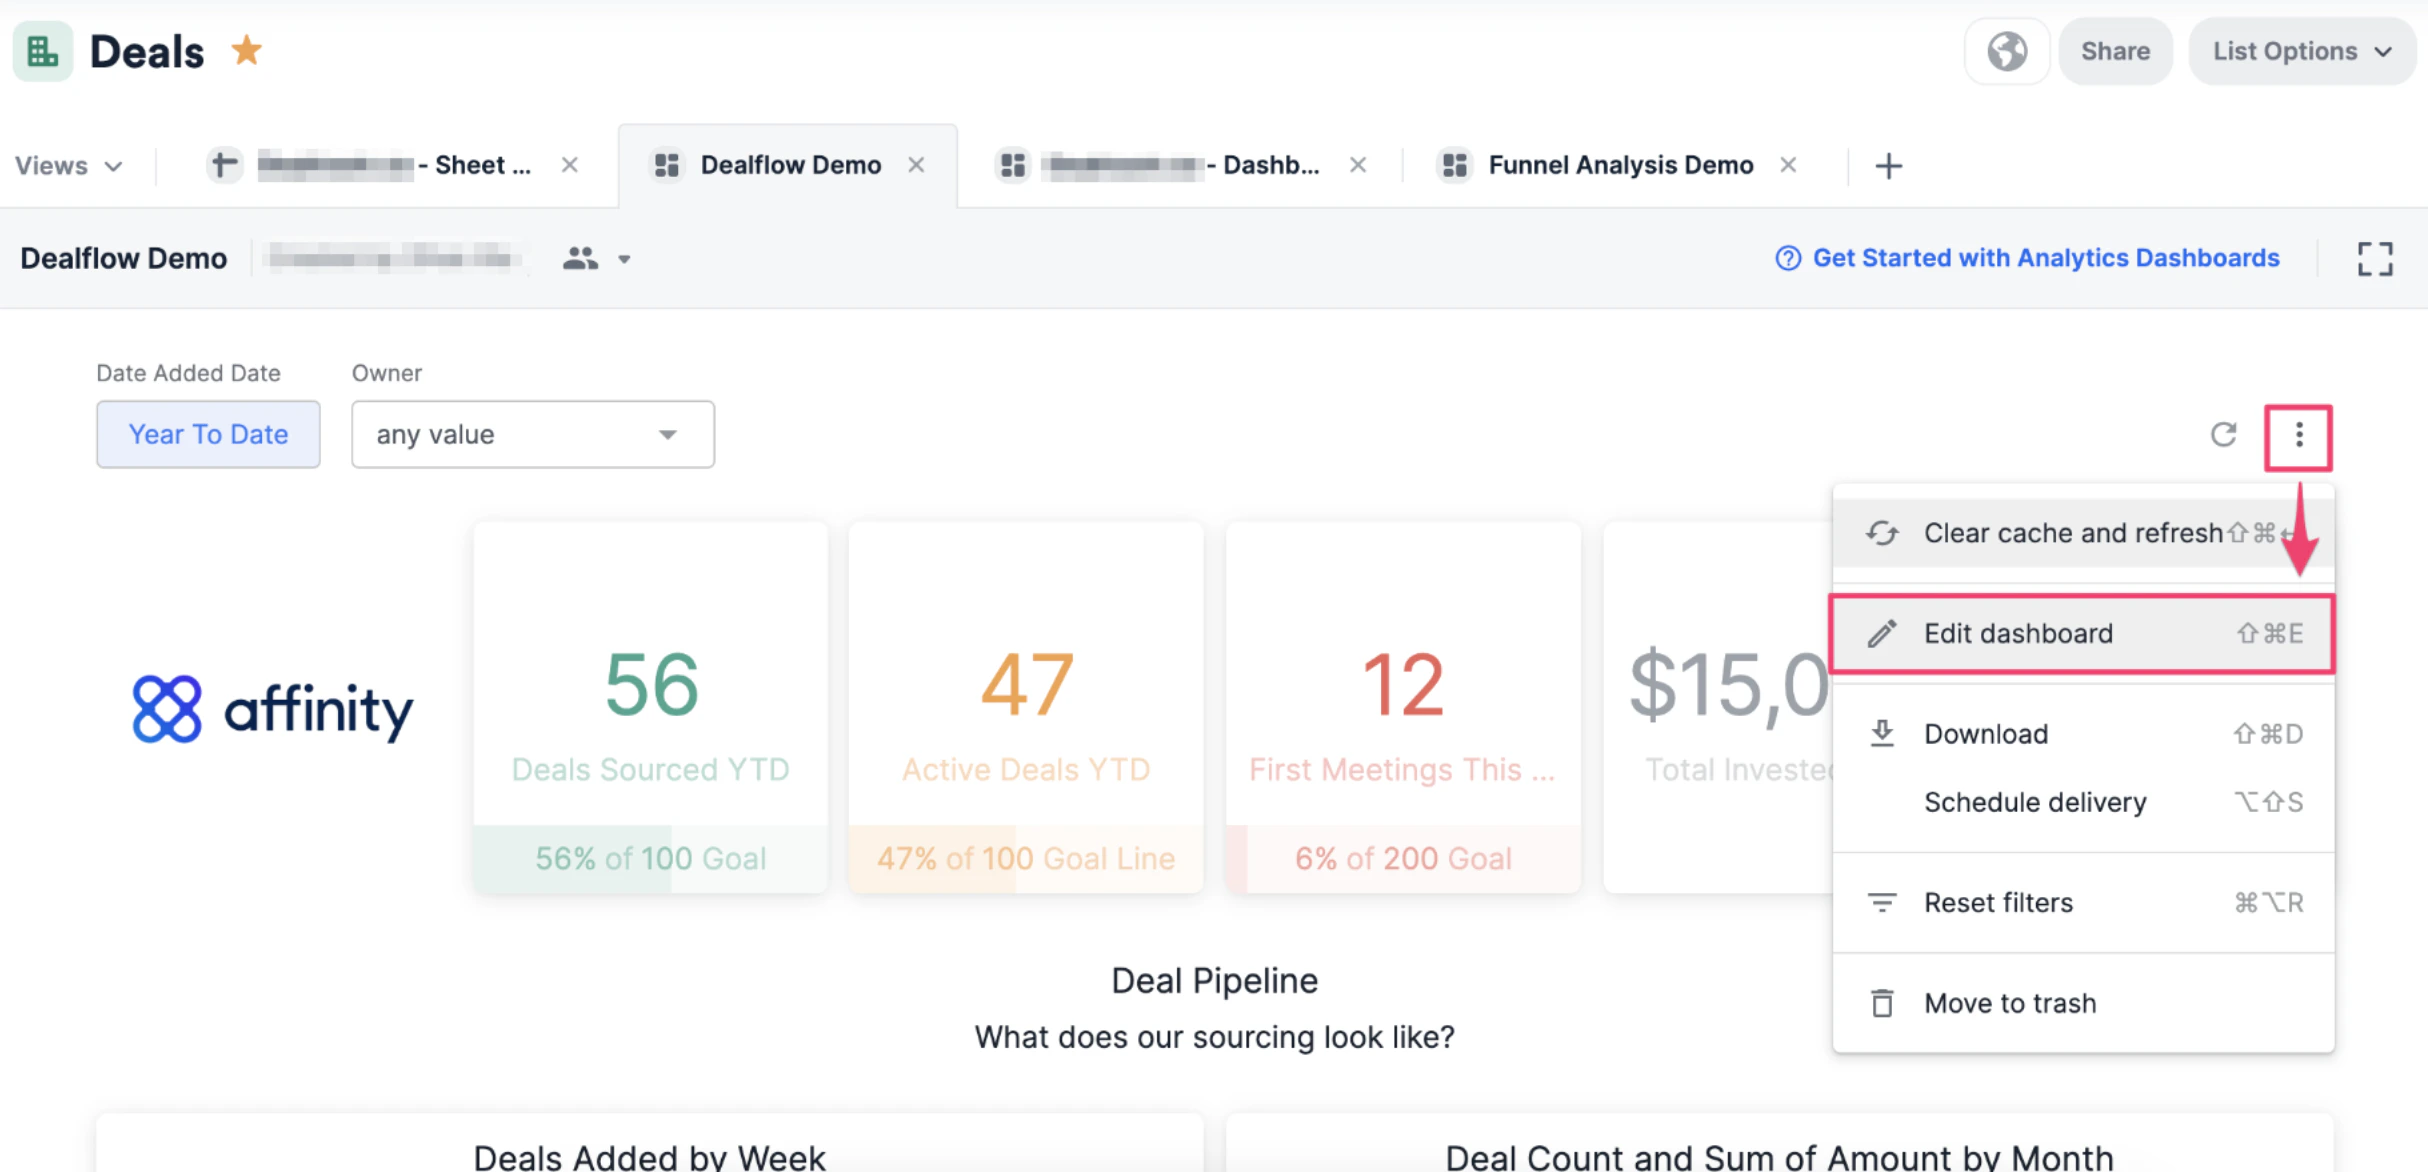
- On the dashboard view you’d like to create these custom fields in, click the ellipsis (3 dotted icon), then click Edit dashboard.
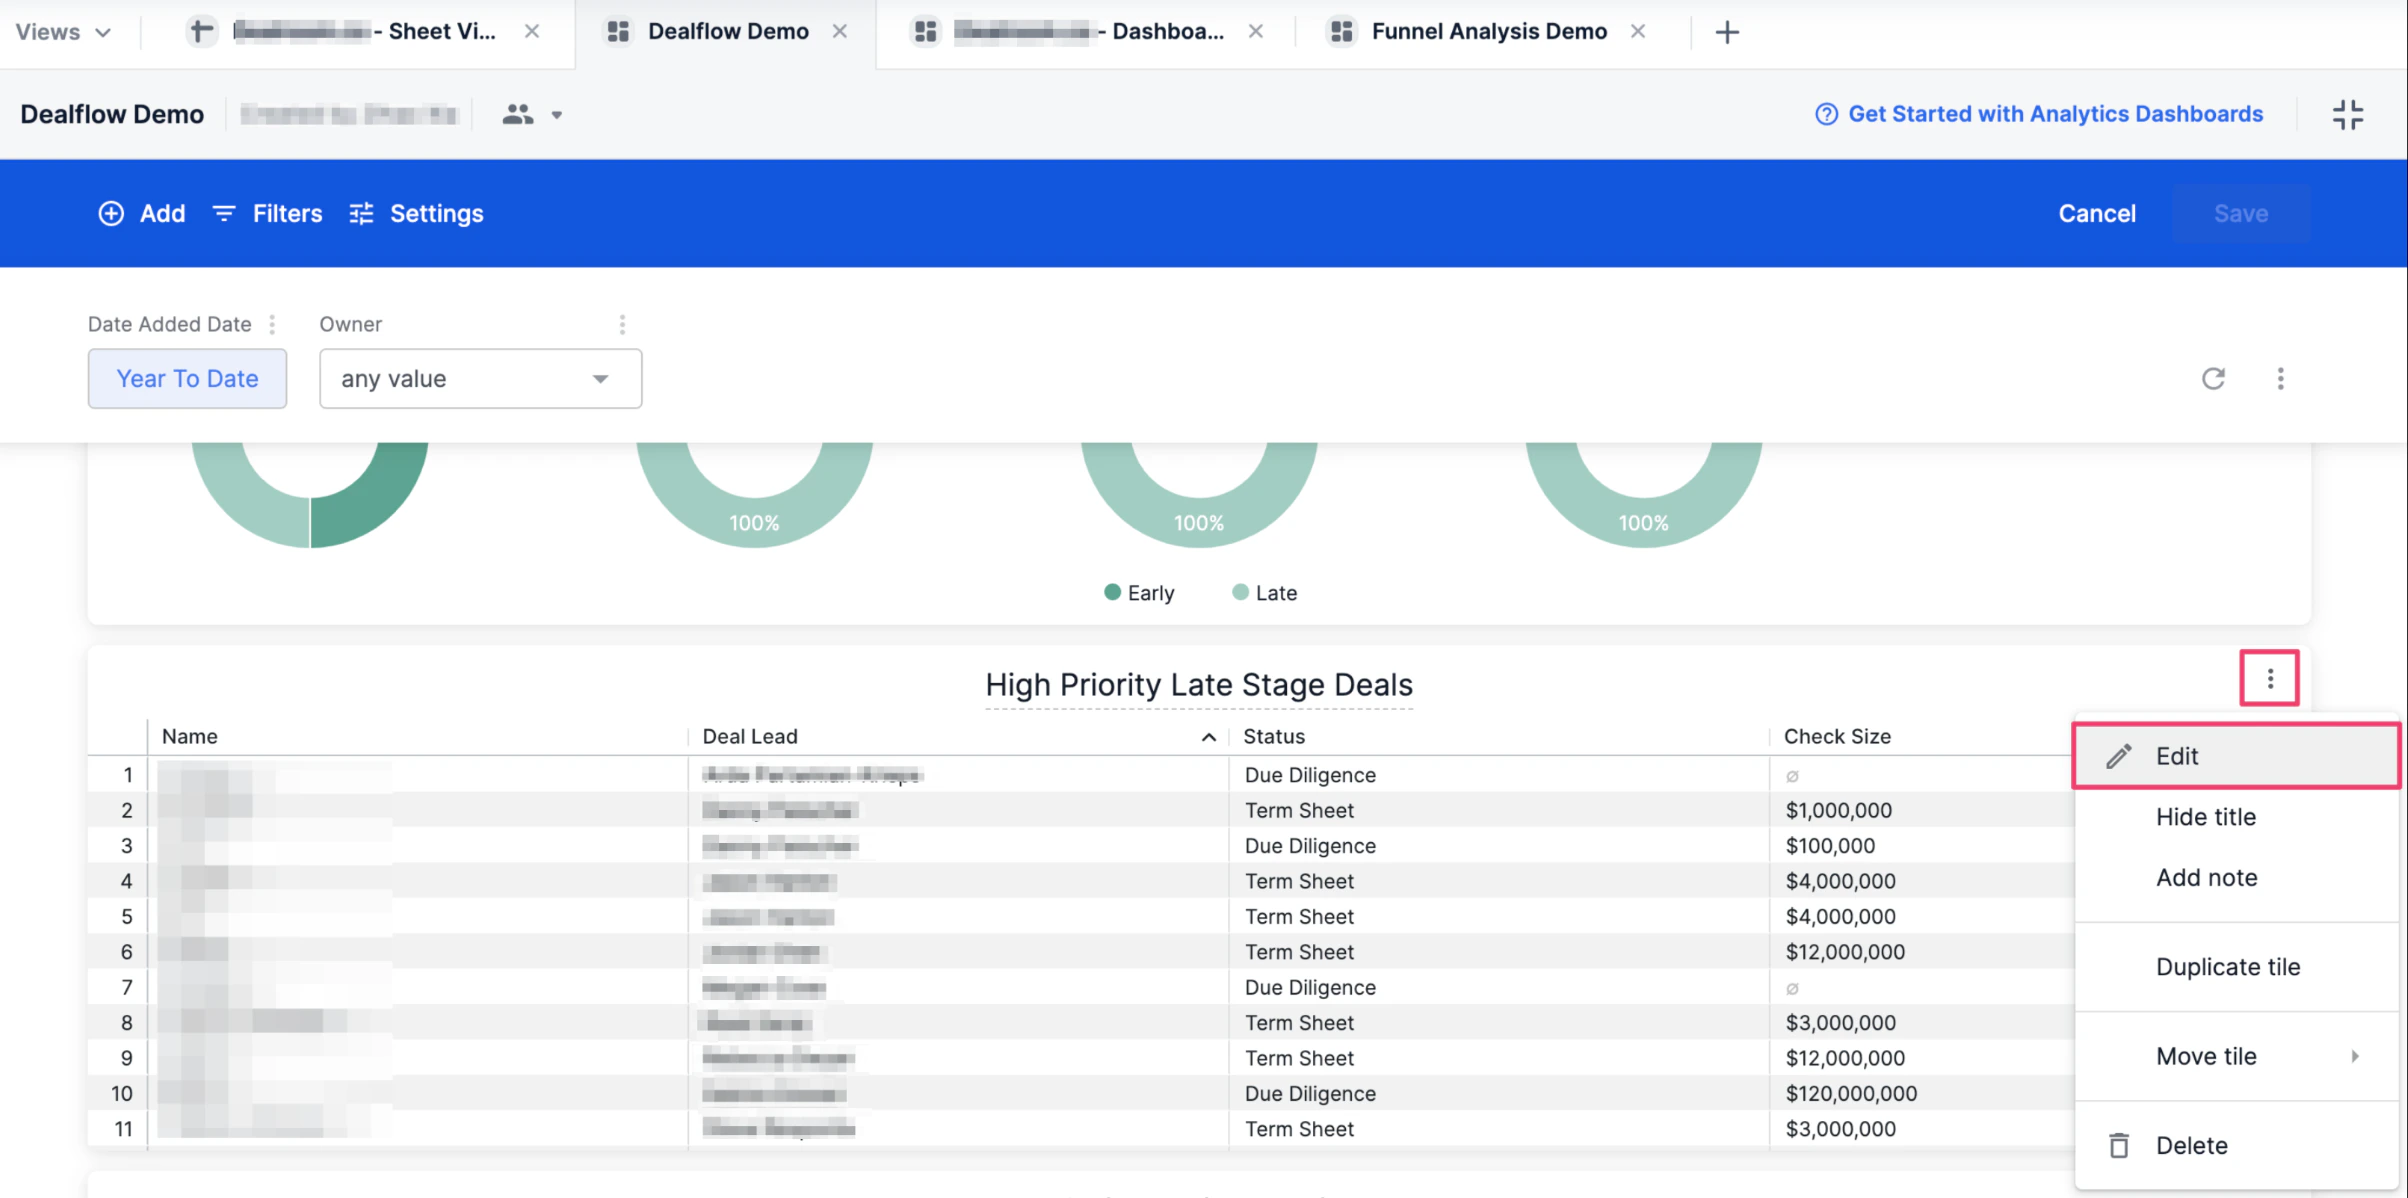
- Click the ellipsis (3 dotted icon) on the specific tile that you’d like to create these custom fields in, then click Edit.
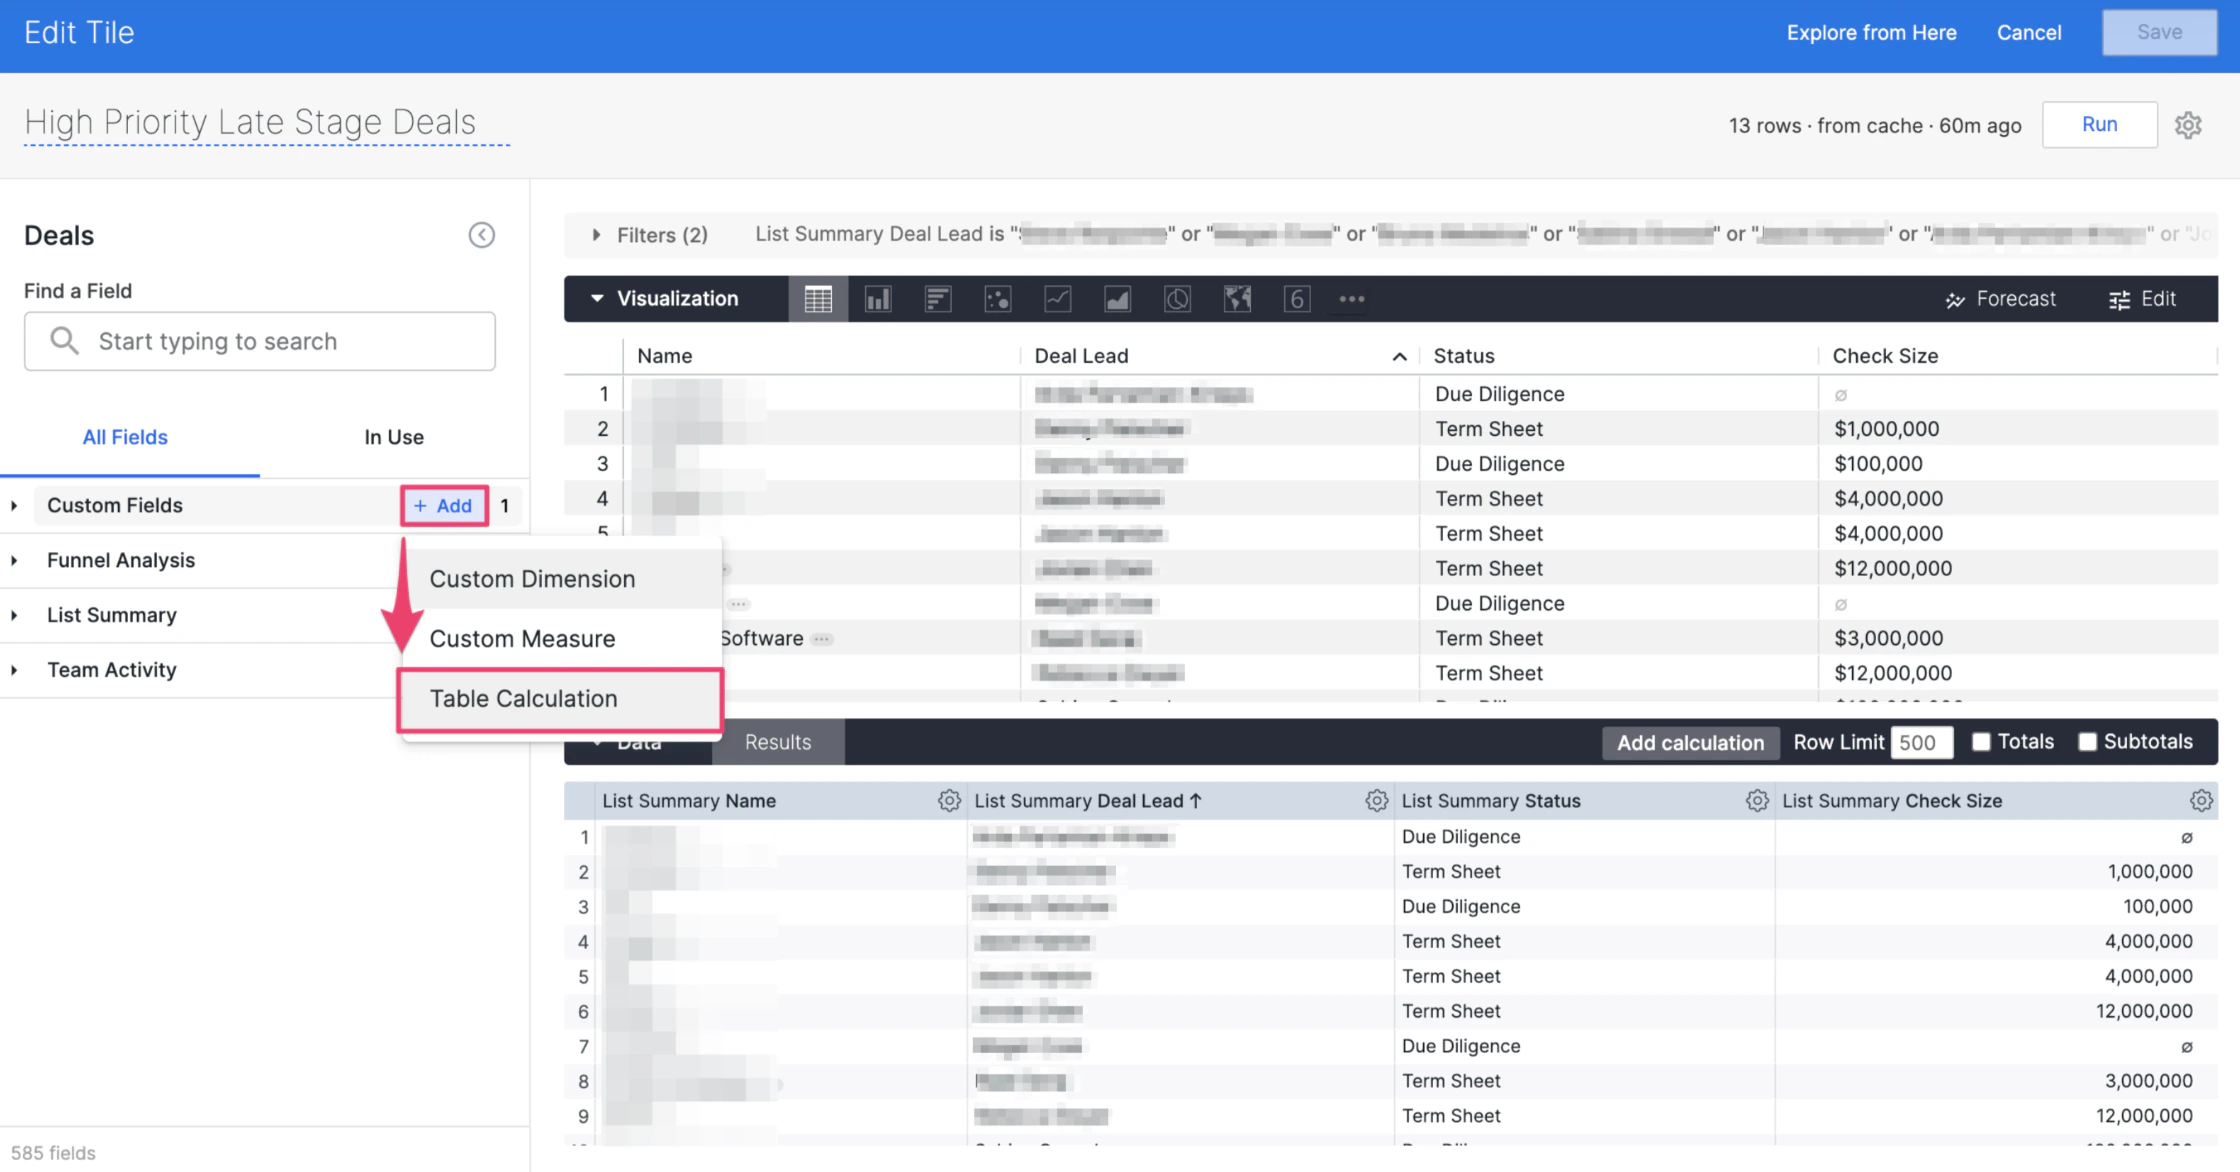
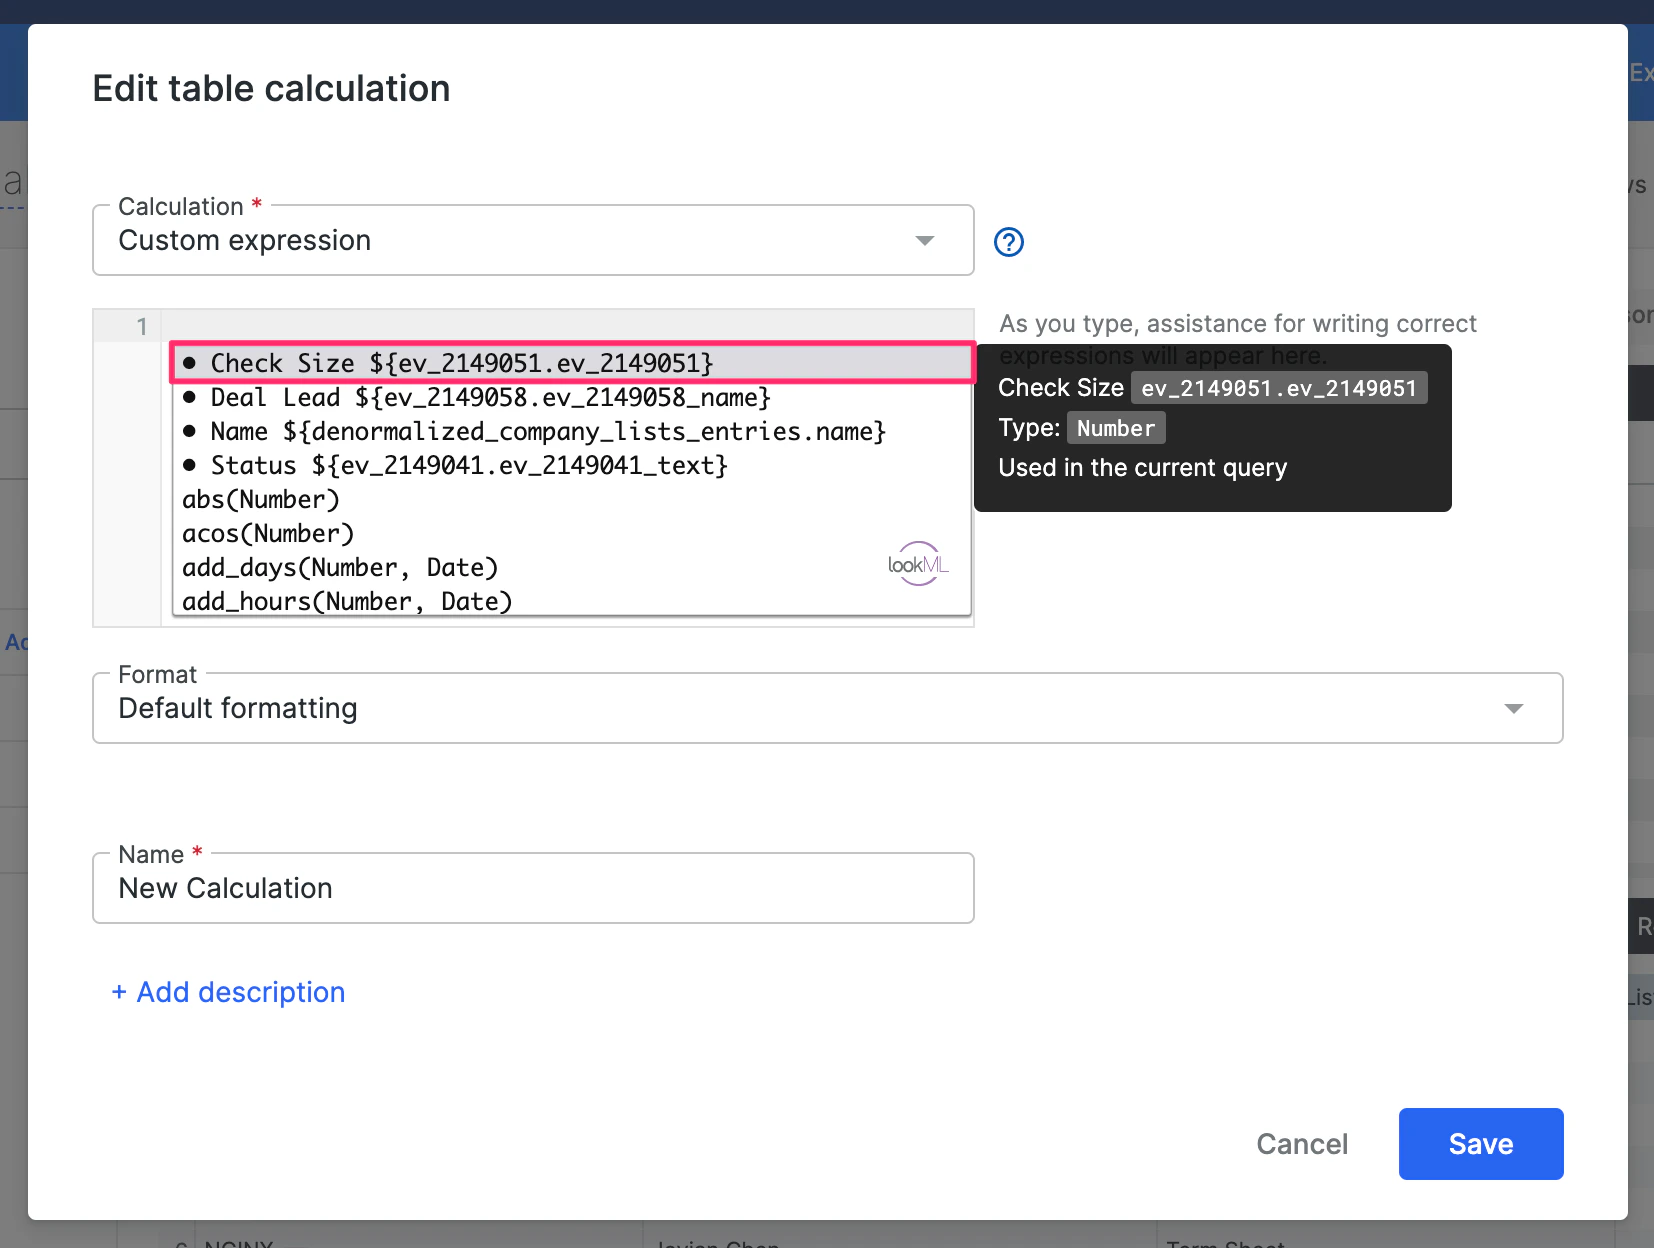
- In this example, we’ll go over how to create a new table calculation based on the Check Size dimension shown in this visualization tile. To create this new table calculation, click + Add next to the Custom Fields section, then click Table Calculation.
- Let’s say this newly-calculated field is meant to track an adjusted amount of the Check Size based on the commission percentage our Sales Team receives for their closed deals. Therefore, click on the text box and select Check Size.
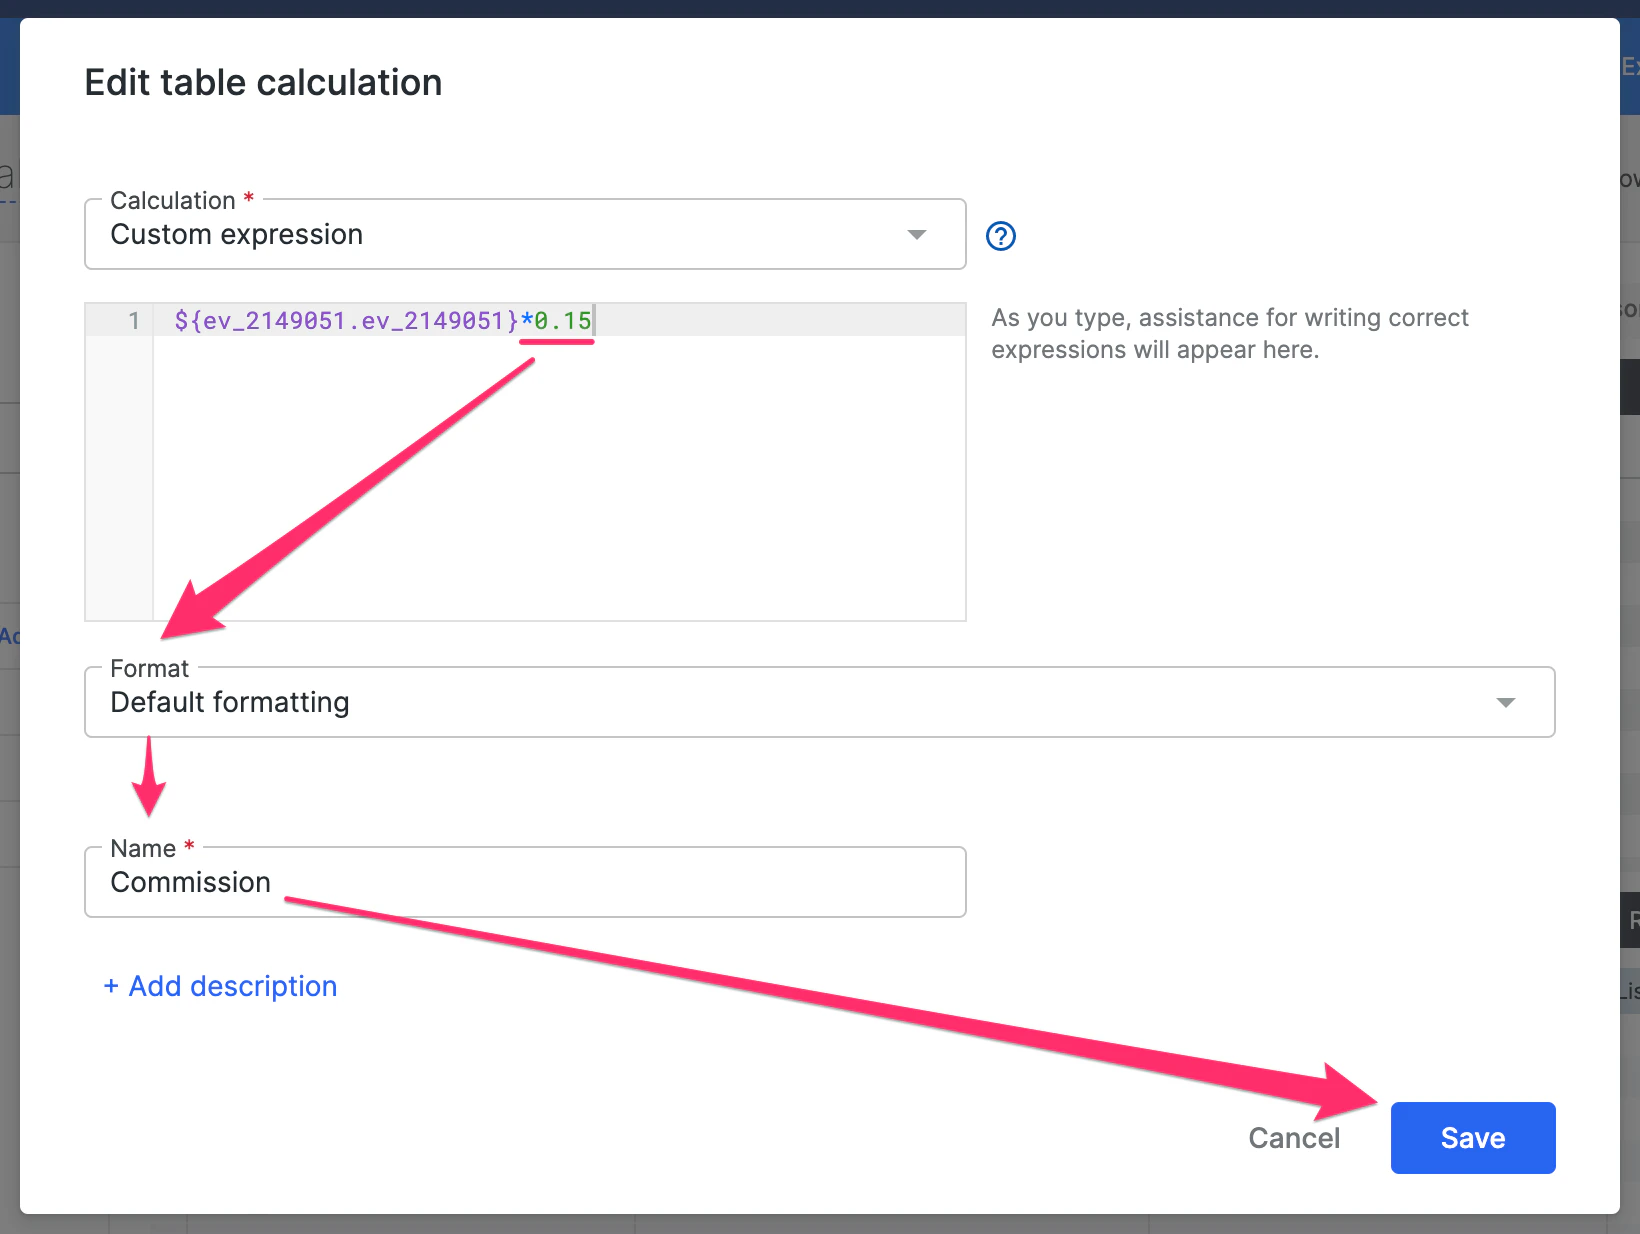
- Now, we’ll use the asterisk (*) to multiply Check Size by the commission percentage of 15% (0.15). Then, select whatever currency format applies to you/your team in the Format field (e.g. Dollars, Pounds, or Euros), name this new field (e.g. Commission), and click Save.
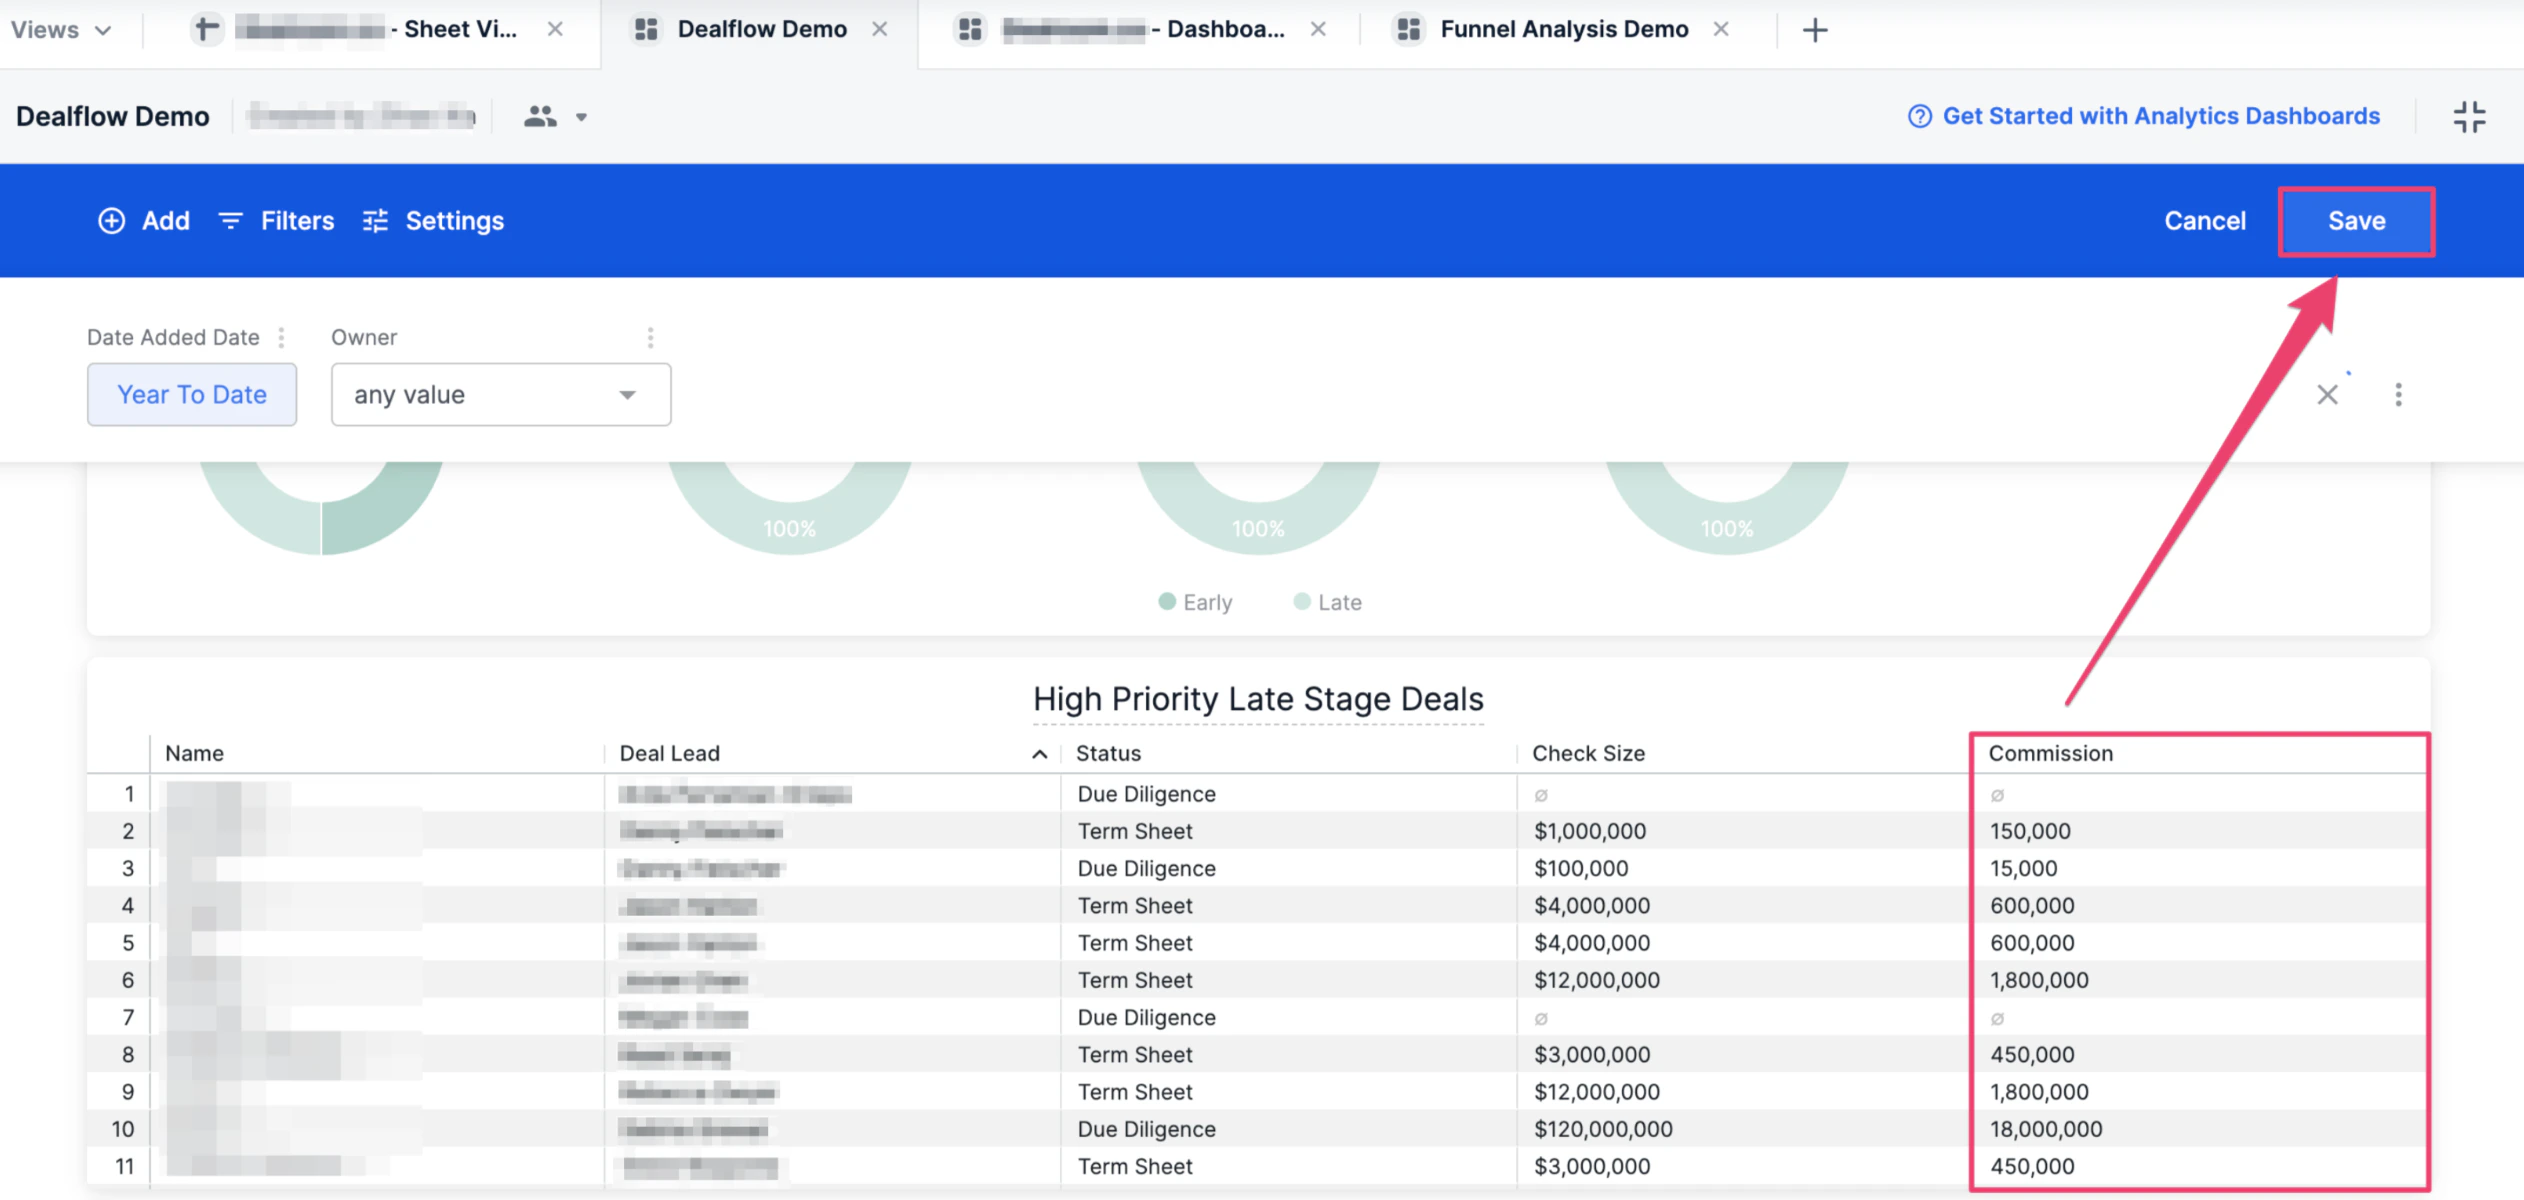
- Now, you’ll see Commission as a new field showing up in the Visualization section - click Run to make sure any other changes applied render successfully, then click Save.
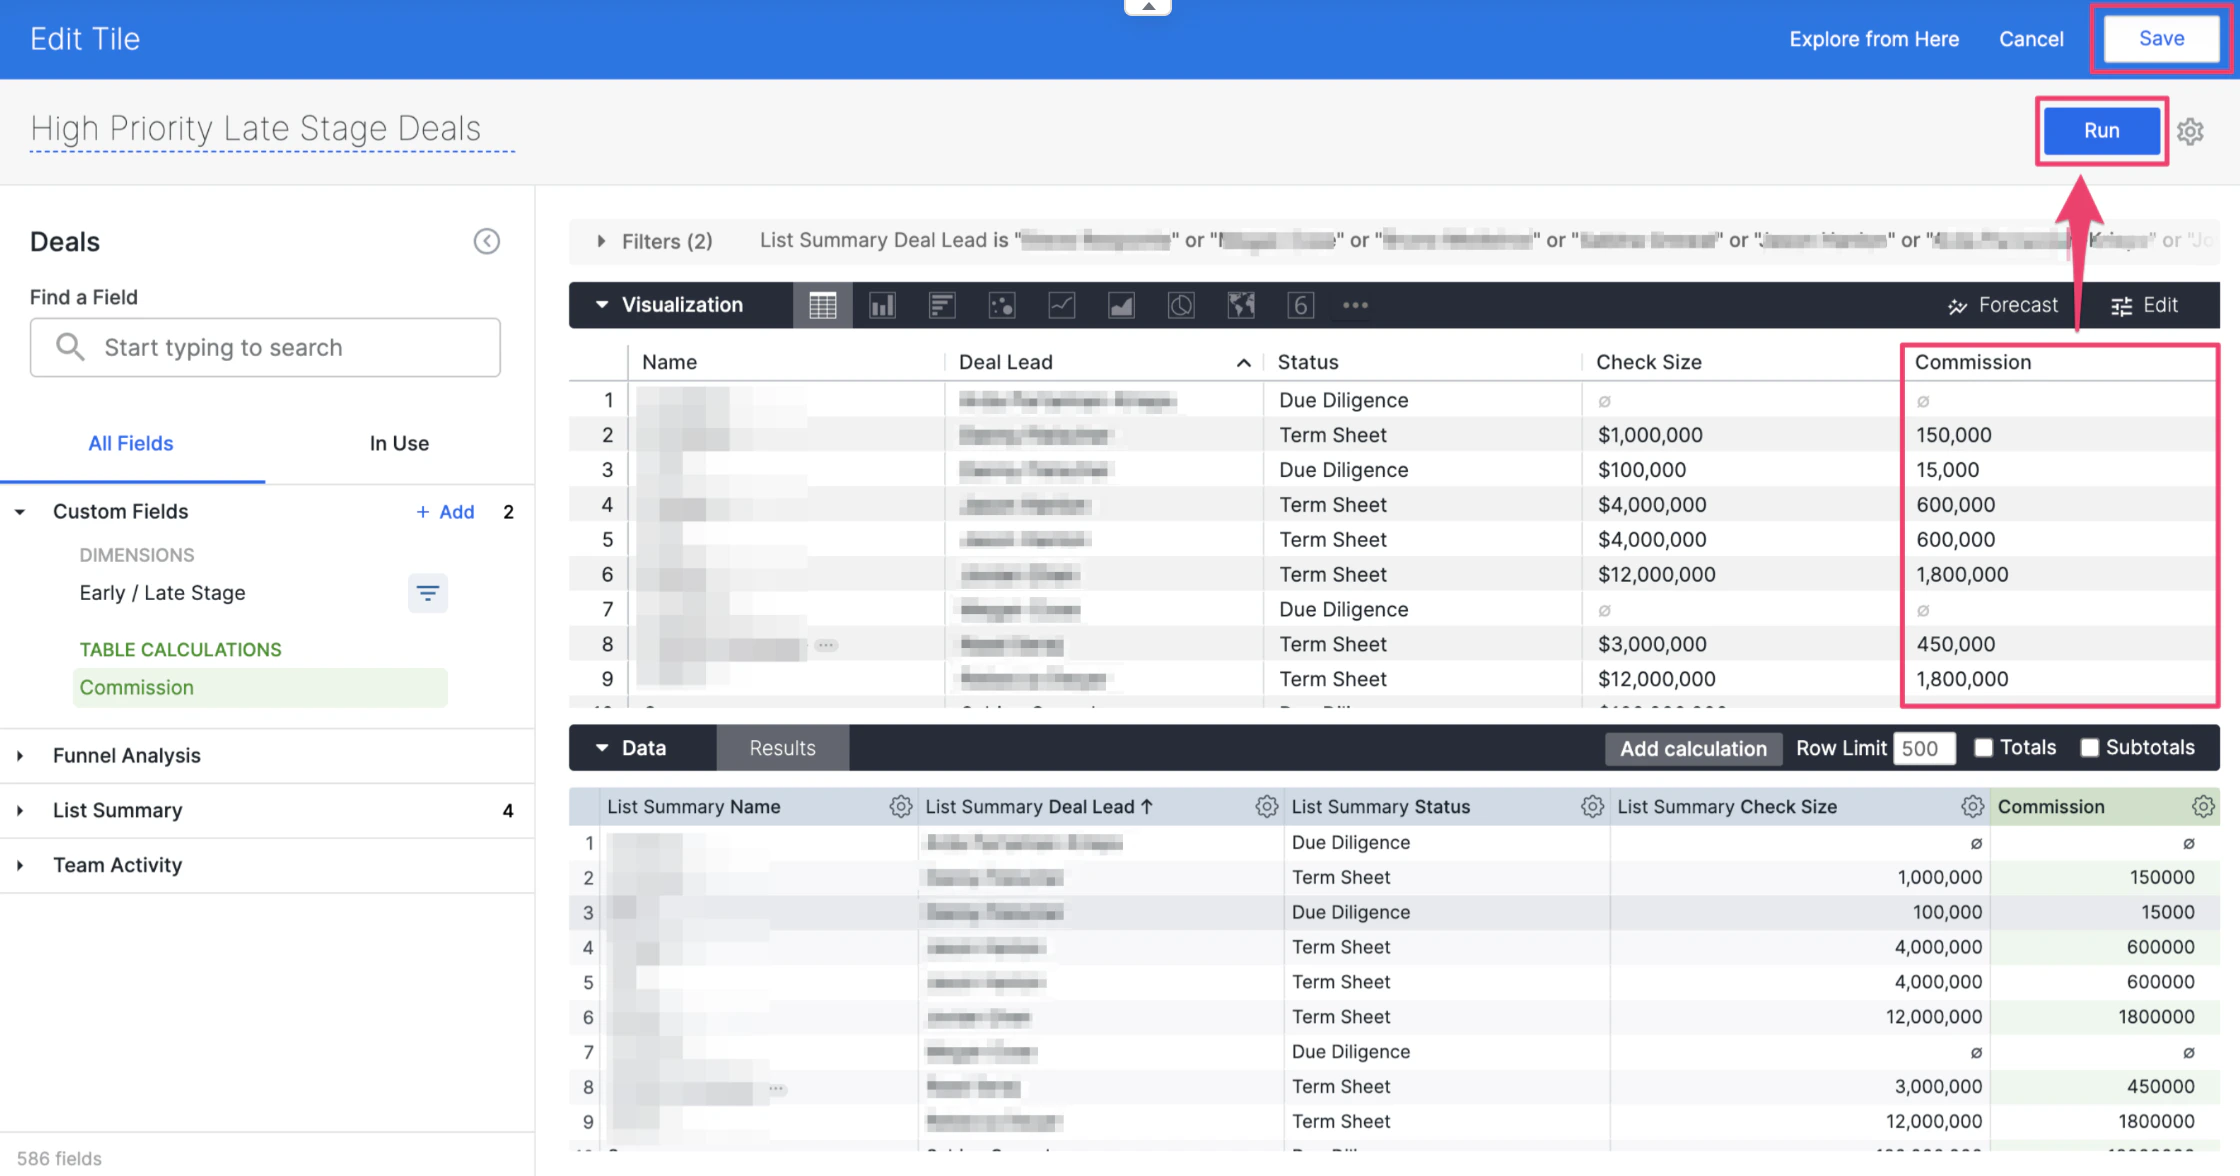
- Click Save one more time to ensure all changes to the dashboard view are saved, and you’re all set!