
Documentation Index

Fetch the complete documentation index at: https://support.affinity.co/llms.txt

Use this file to discover all available pages before exploring further.

Reference — lookup information.
Performance Reports will show you the people, organizations, or opportunities added to a list over a selected time period. See and compare how many deals your team has closed over time.
  • Please note that Basic Reporting is a legacy feature that is no longer available for new customers.
    • For those on the Scale, Advanced, and Enterprise tiers, you can leverage advanced reporting features with Affinity Analytics.
    • For those on the Essential tier, we highly suggest upgrading to the Scale, Advanced, or Enterprise tiers to leverage Affinity Analytics.
  1. Click the Reports tab on your global navigation bar.
  1. To customize your view, first select a list.
Note: By default, there will be a list with preset filters set to show deals with a status of “Won” over the past month. You can adjust these by hovering over ”# of active filters” to see applied filters. 3. Then, toggle between different views by filtering Close Date to a time period, and View by Days, Weeks, Months, Quarters, or Years. 4. Finally, group by additional fields to segment your data by owner, industry, and more.

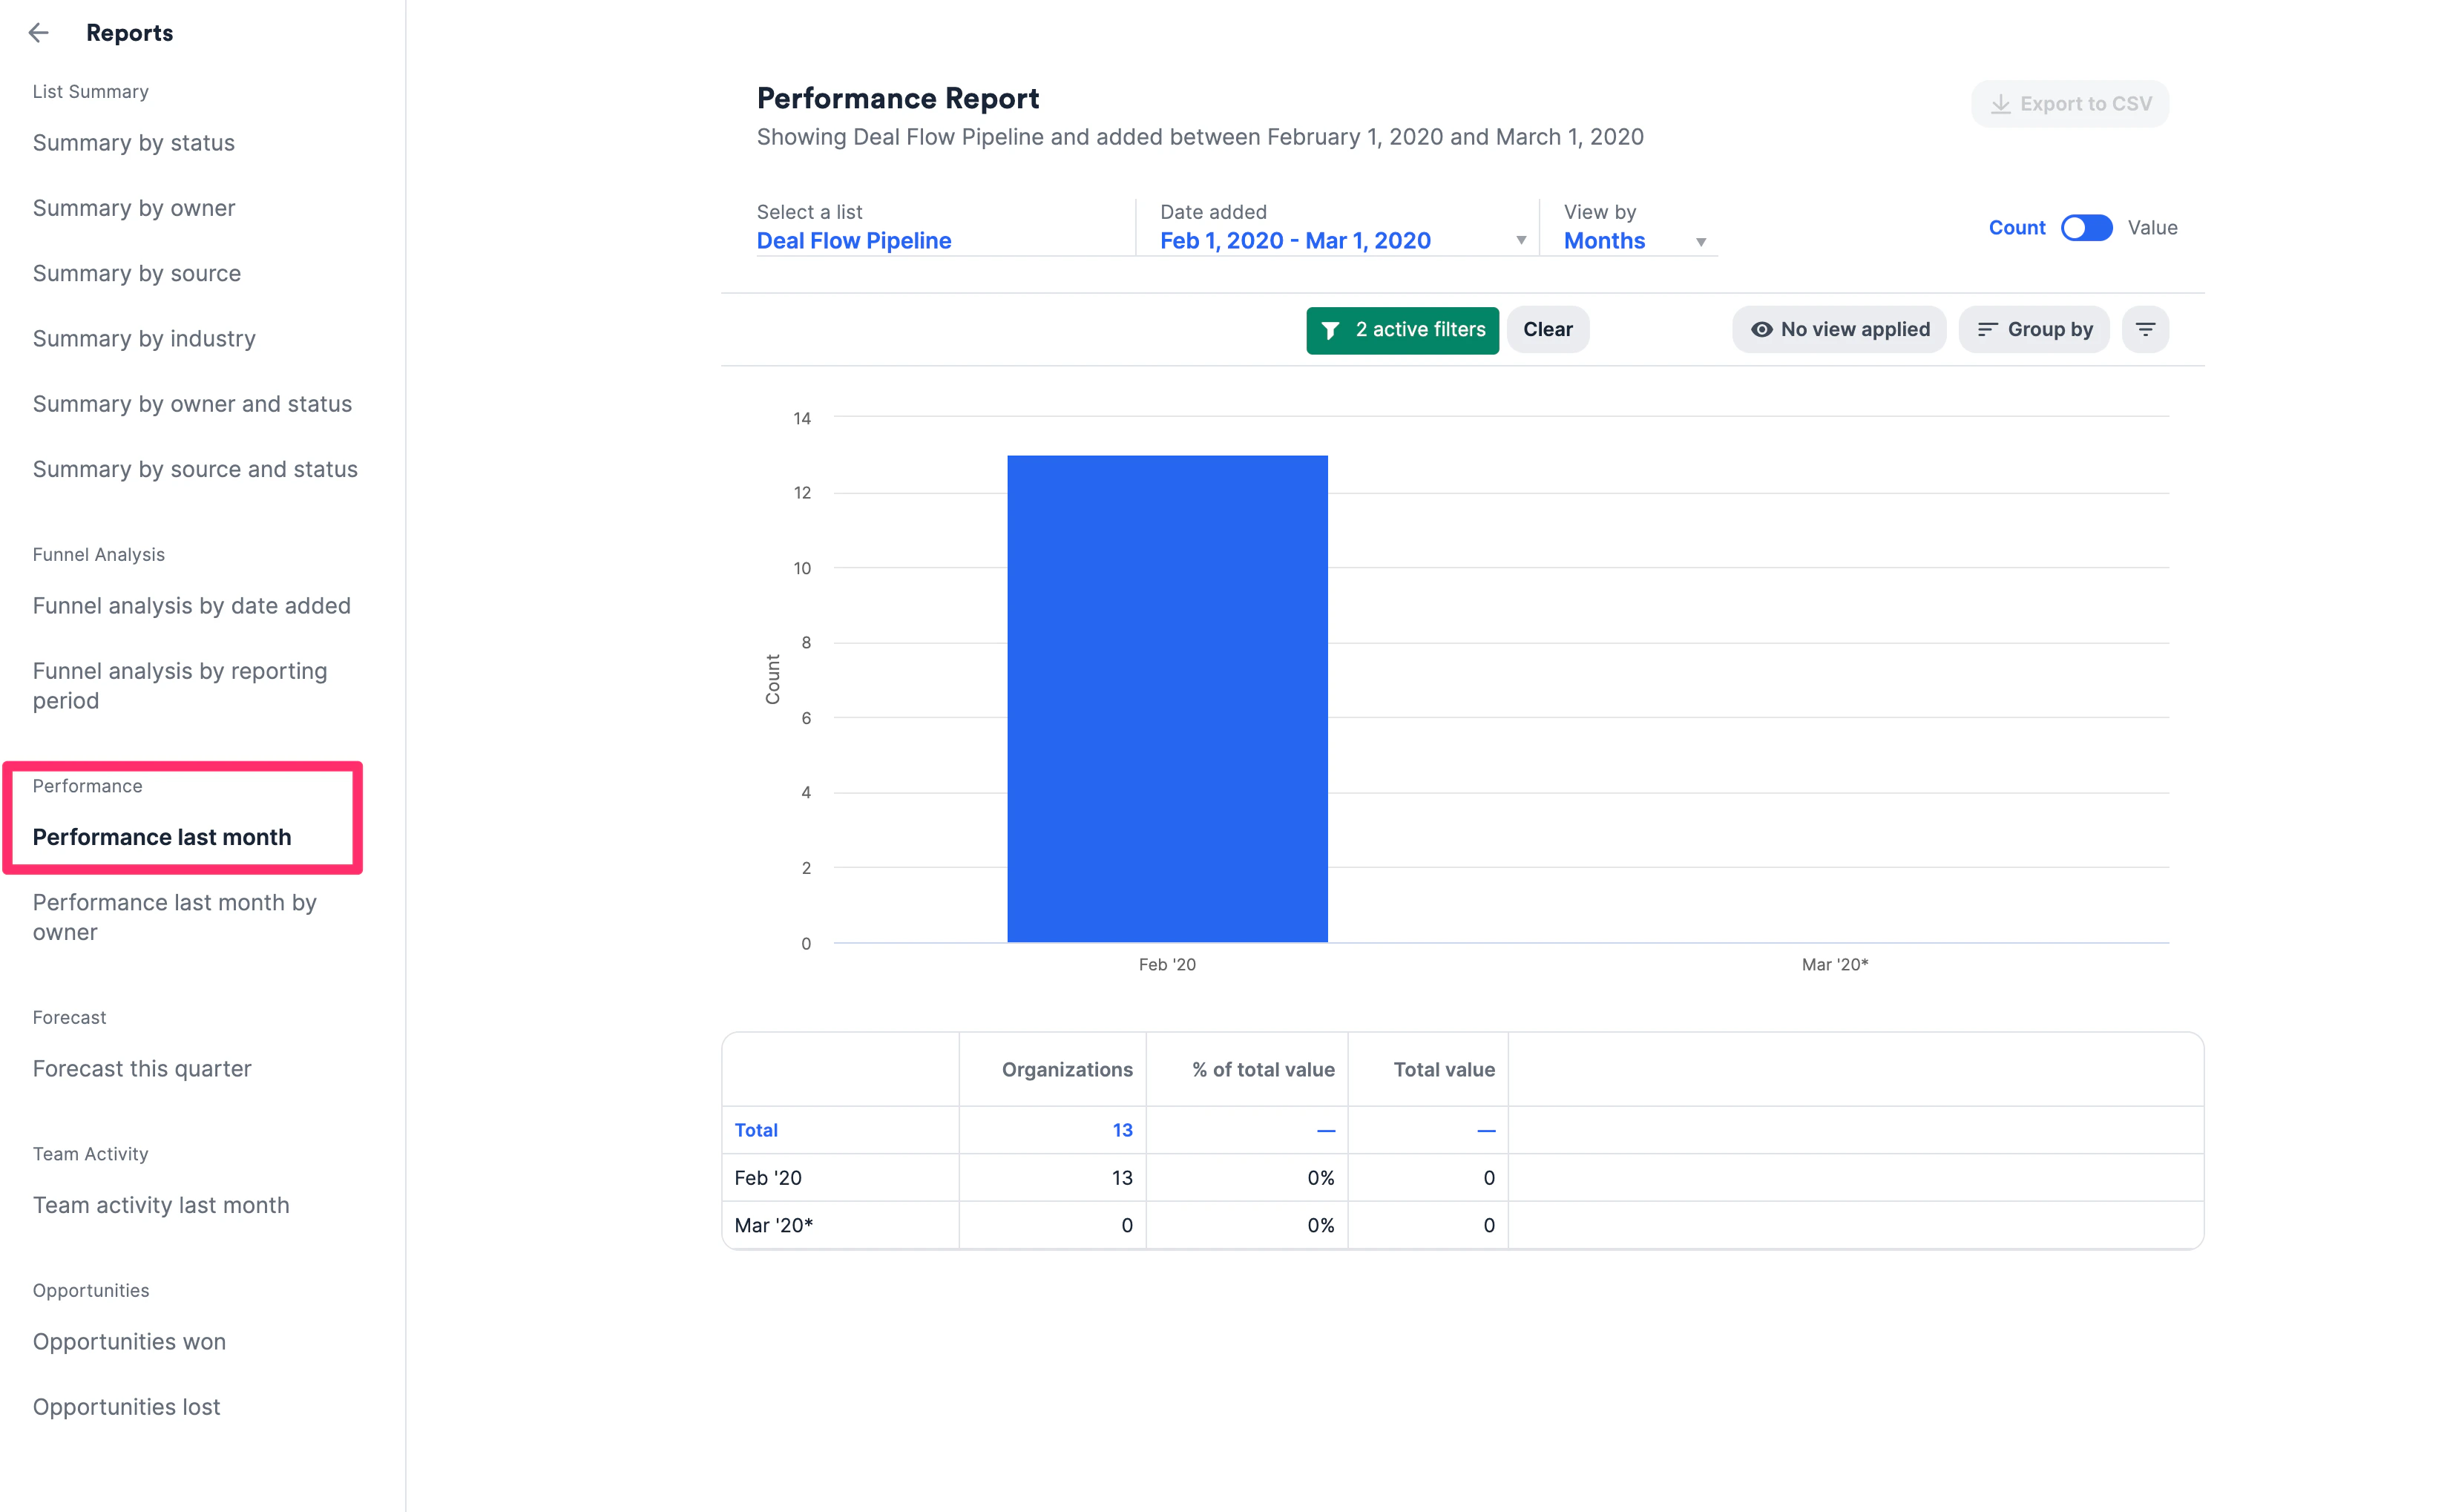
Performance last month by owner

Filter by various Owners to further enhance this view and help your team keep track of their Opportunities.