> ## Documentation Index
> Fetch the complete documentation index at: https://support.affinity.co/llms.txt
> Use this file to discover all available pages before exploring further.
# How To Track Average Days Spent In Each Status Using Affinity Analytics
> Help center reference: How To Track Average Days Spent In Each Status Using Affinity Analytics
**Advanced** — power-user technique.
Whether you're in private capital and analyzing your deal funnel, or in business development and optimizing your prospecting pipeline, a common question we hear is "Where are we spending too much time?" We'll show you how to leverage Affinity Analytics to track average days spent in each stage of your funnel and identify areas of improvement.
**Note**: This video contains the old navigation bar on the top, whereas the current navigation bar now lies on the left side of your screen. While the remaining content is still the same, rest assured that we will be updating our videos accordingly. There is a version available in the [Funnel Analysis template](/s/article/Affinity-Analytics-Funnel-Analysis-Reports), but if you'd like to create your own, here are the following steps:
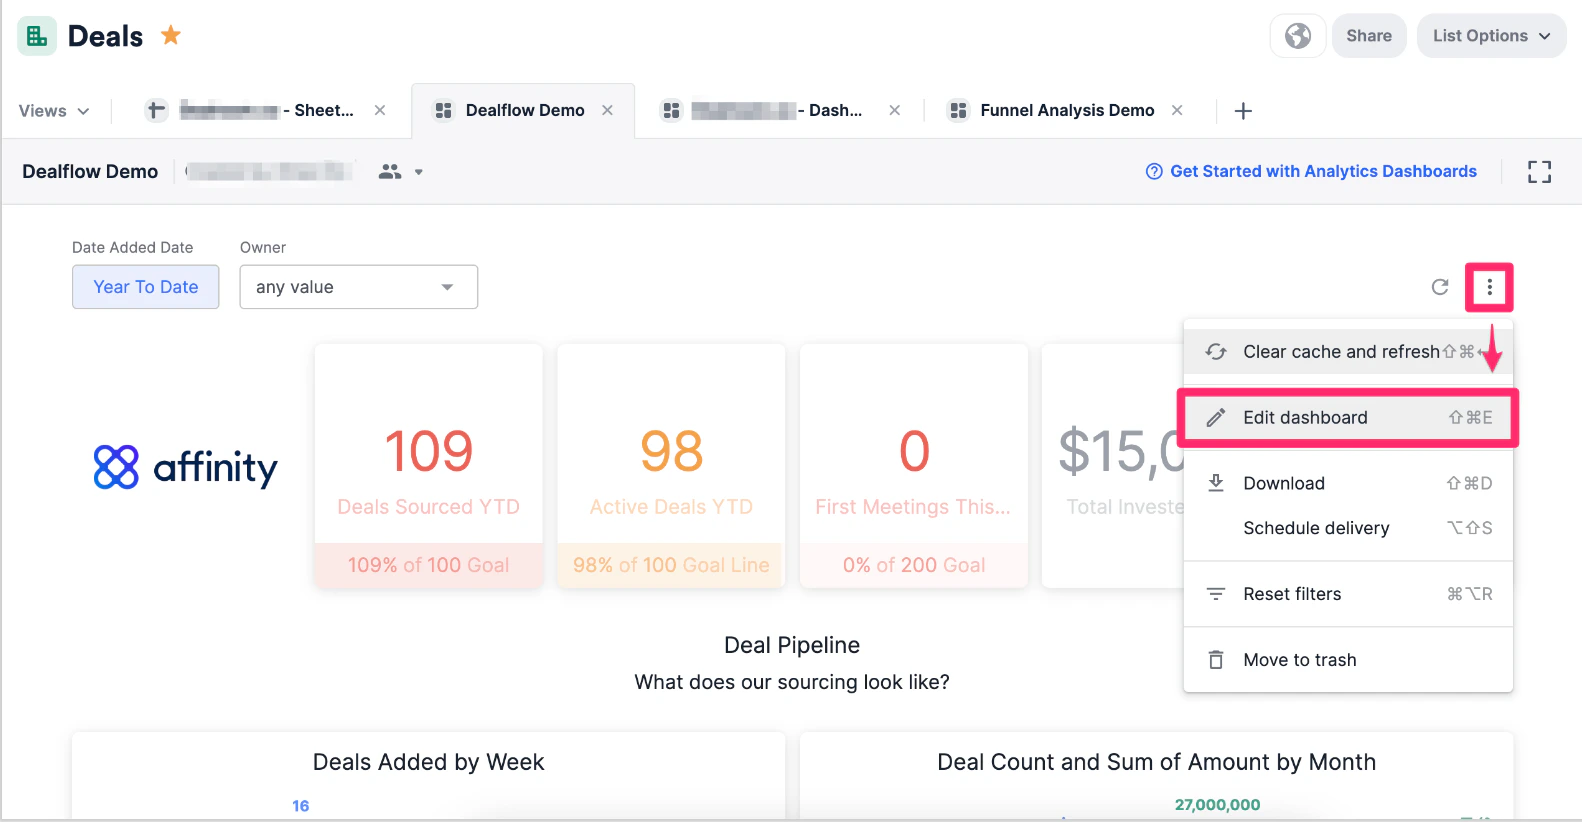
1. Click the ellipsis (3-dotted icon) and click **Edit dashboard** in the dashboard view you'd like to create the visualization in.
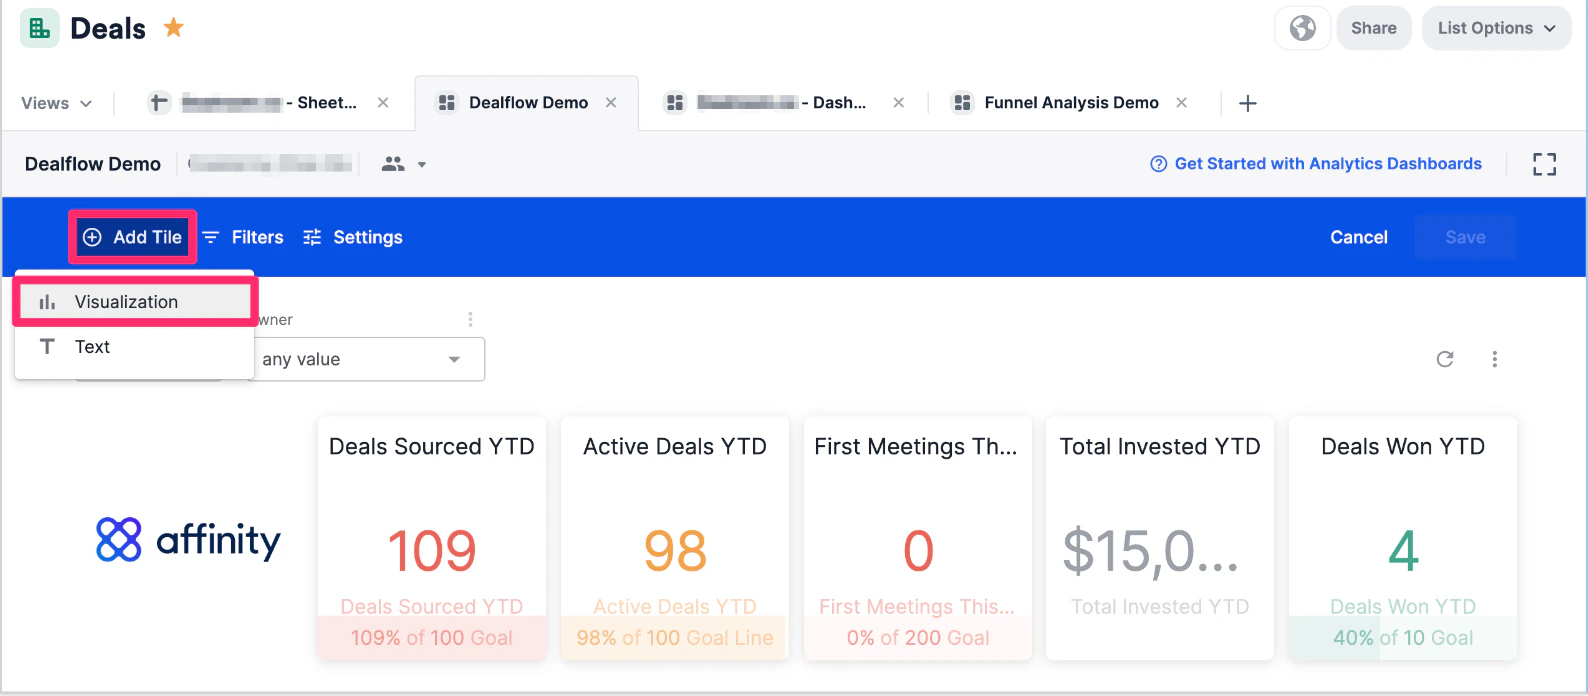
 2. Click **Add tile**, then choose **Visualization**.
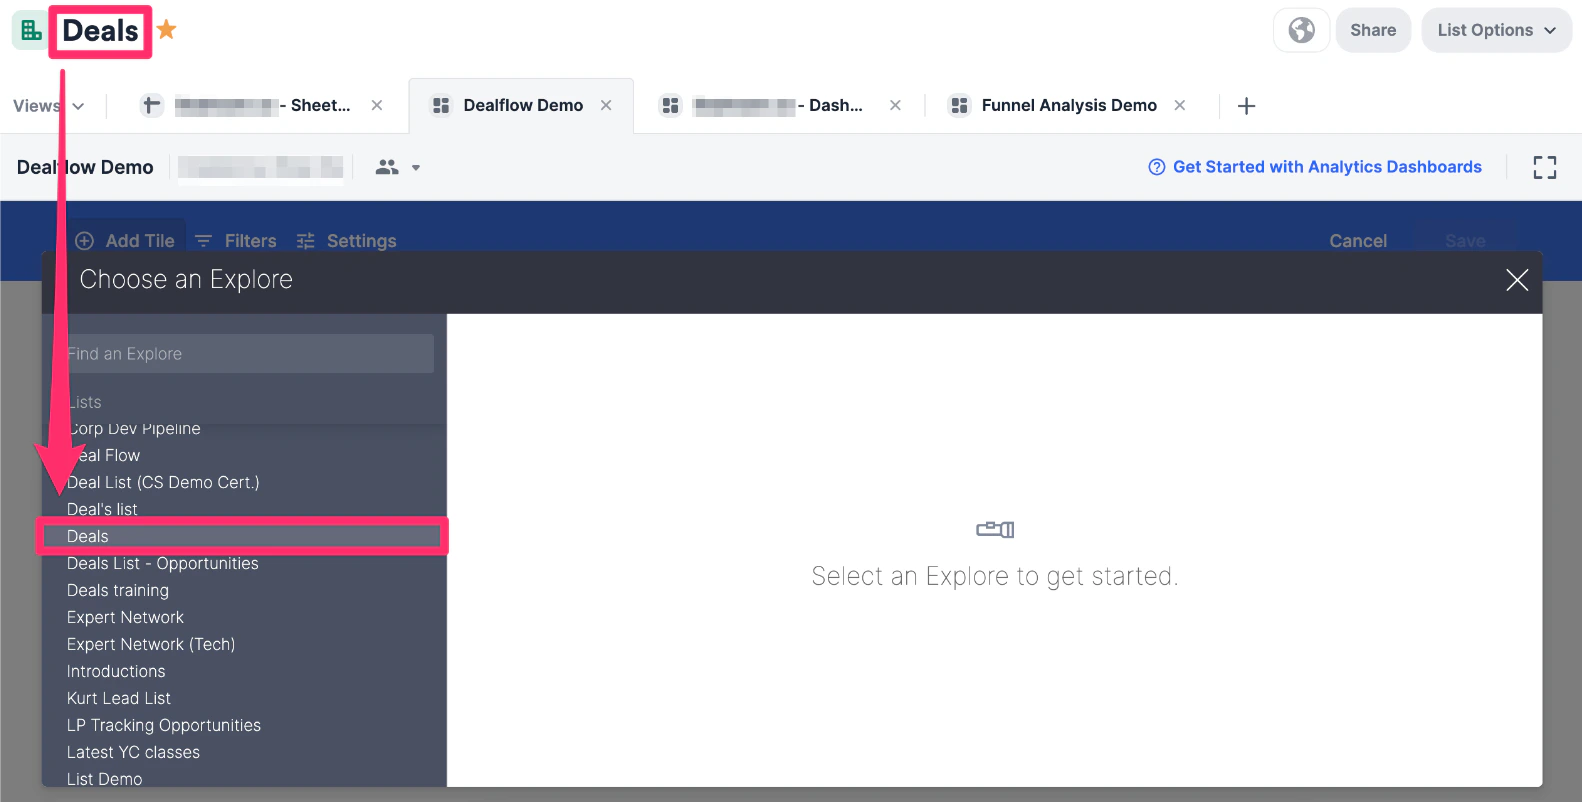
 3. Choose the list or data source for your funnel. We highly recommend that you choose the list you're currently on.
 4. For this visualization, we'll use the Funnel Analysis data points: select **Next Status** for the dimension, then select **Average Days in Next Status** for the measure, then click **Run**.
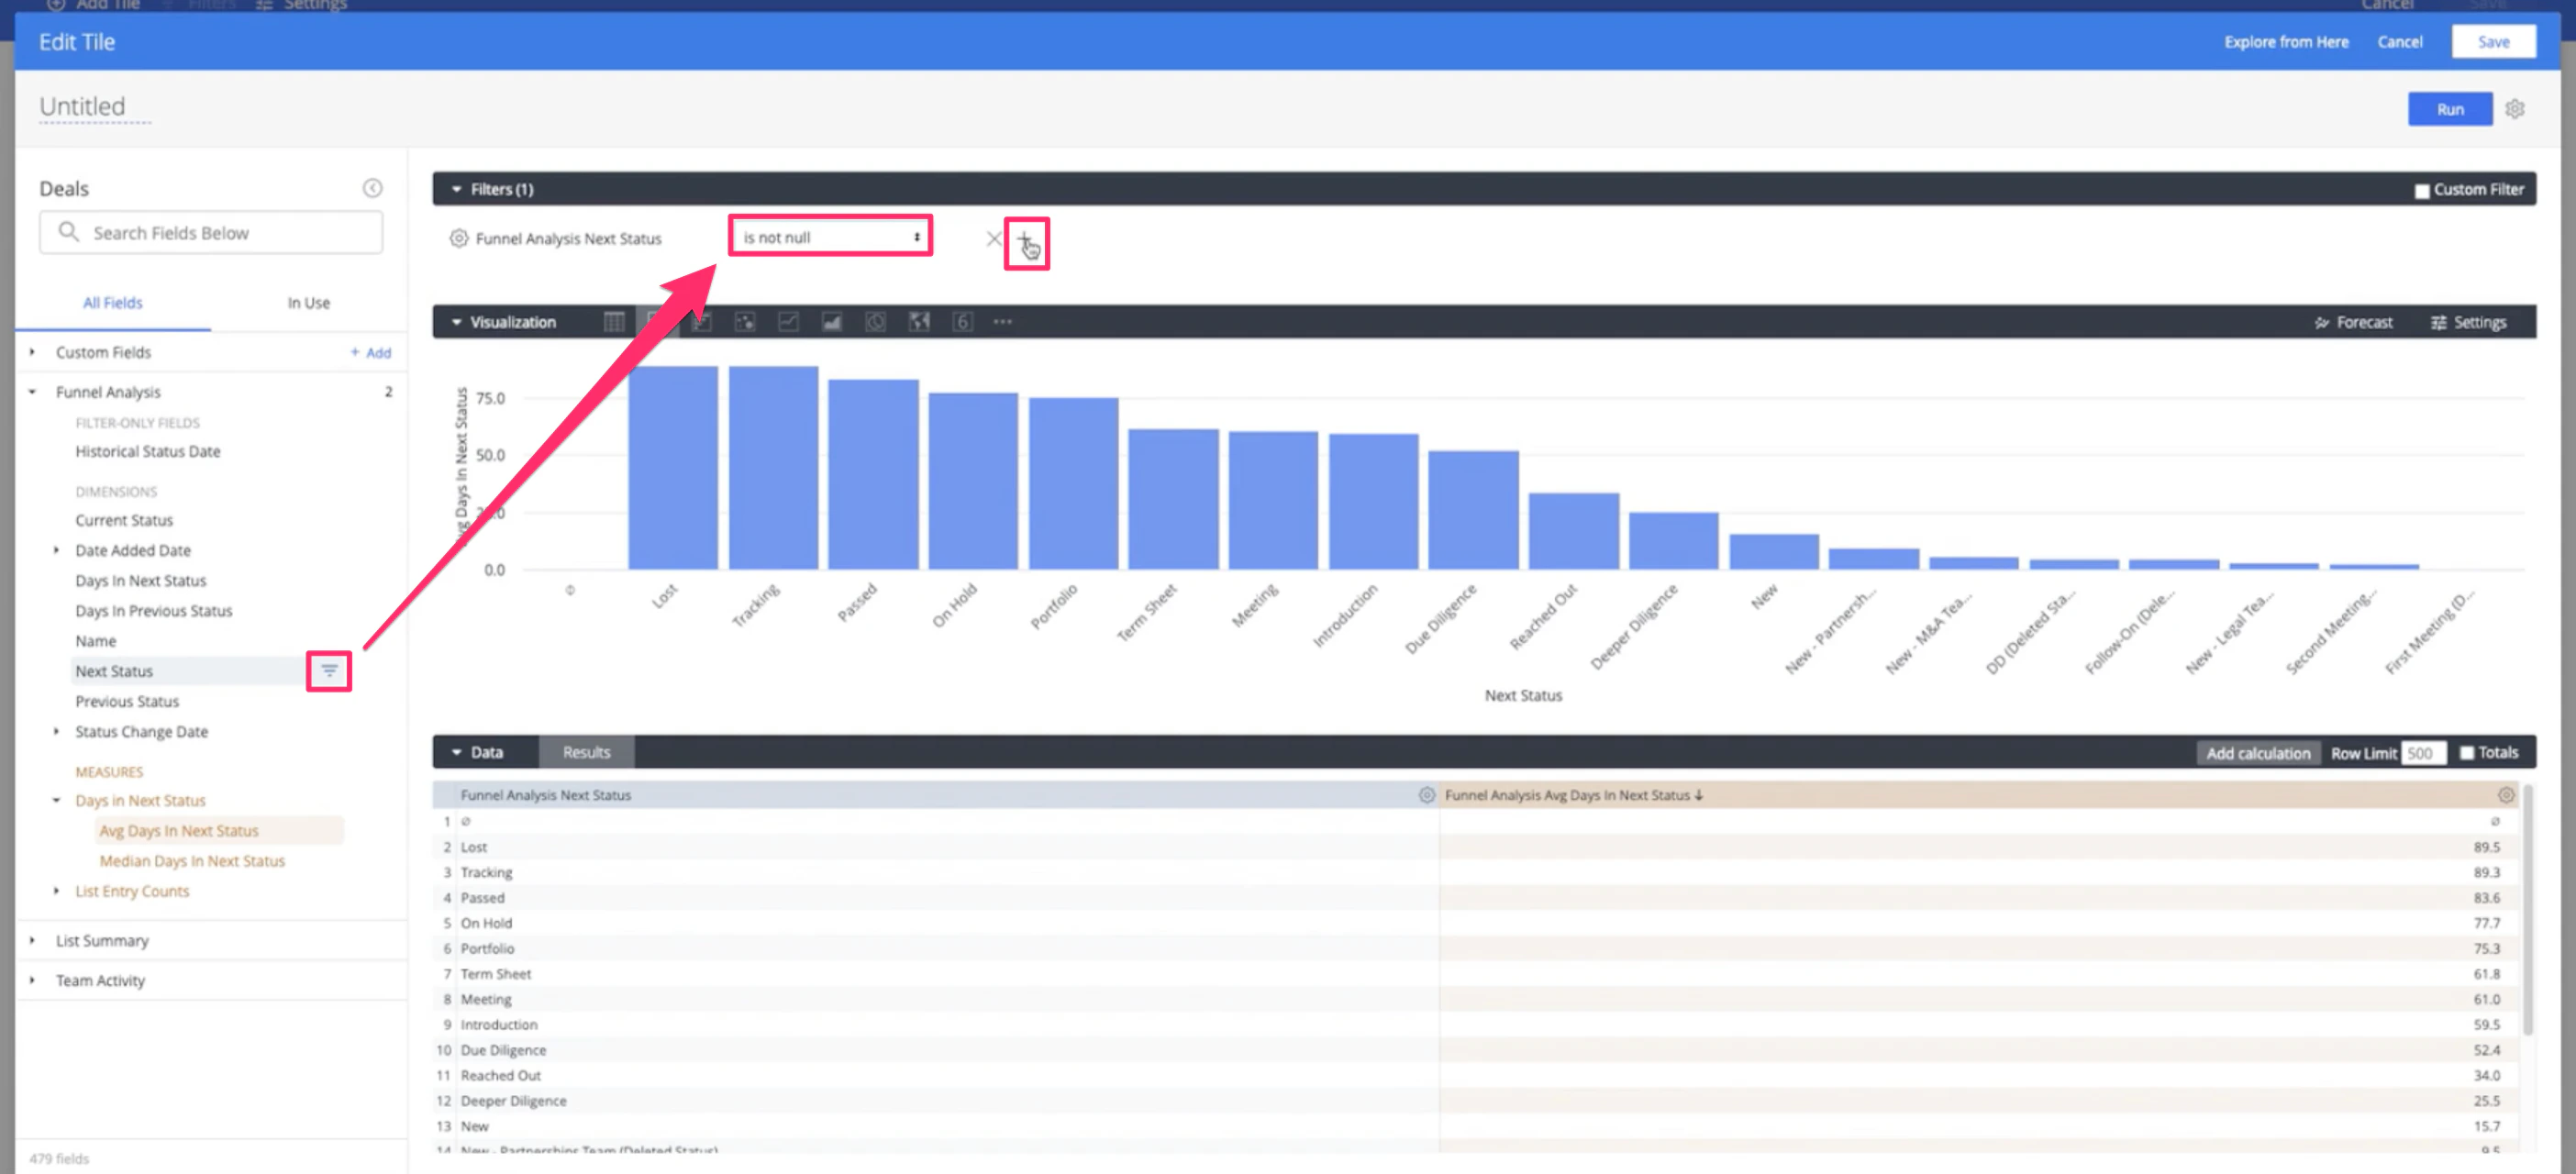
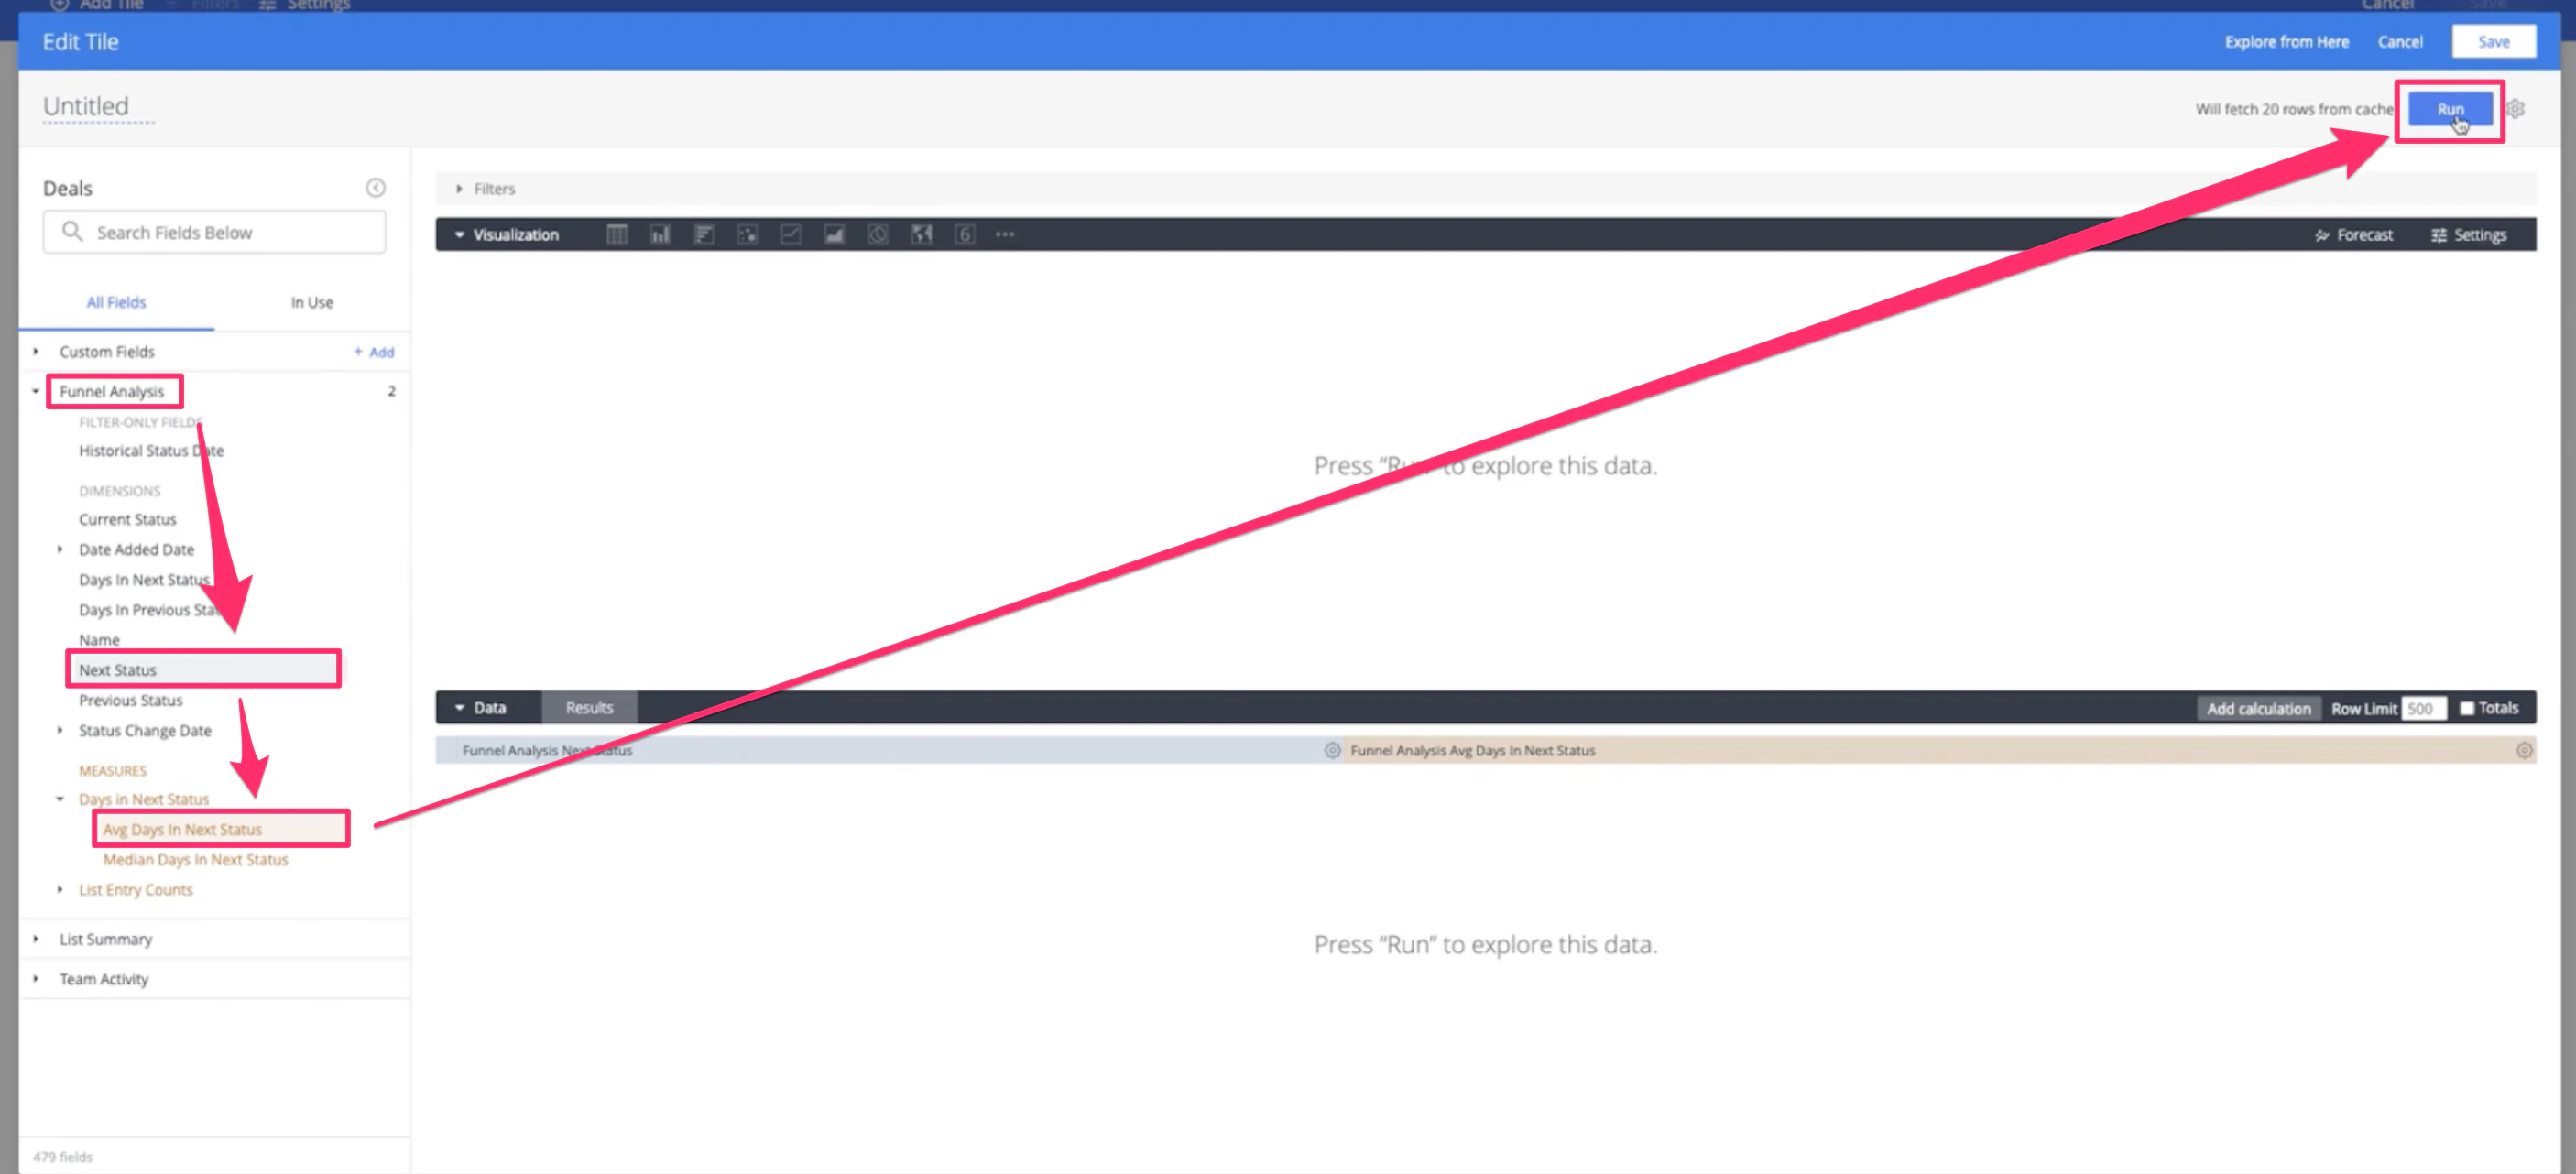 5. Make sure to filter out null values in the **Next Status** dimension. Then, click the **+** icon right next to it to filter out more values as shown in Step 6 below.
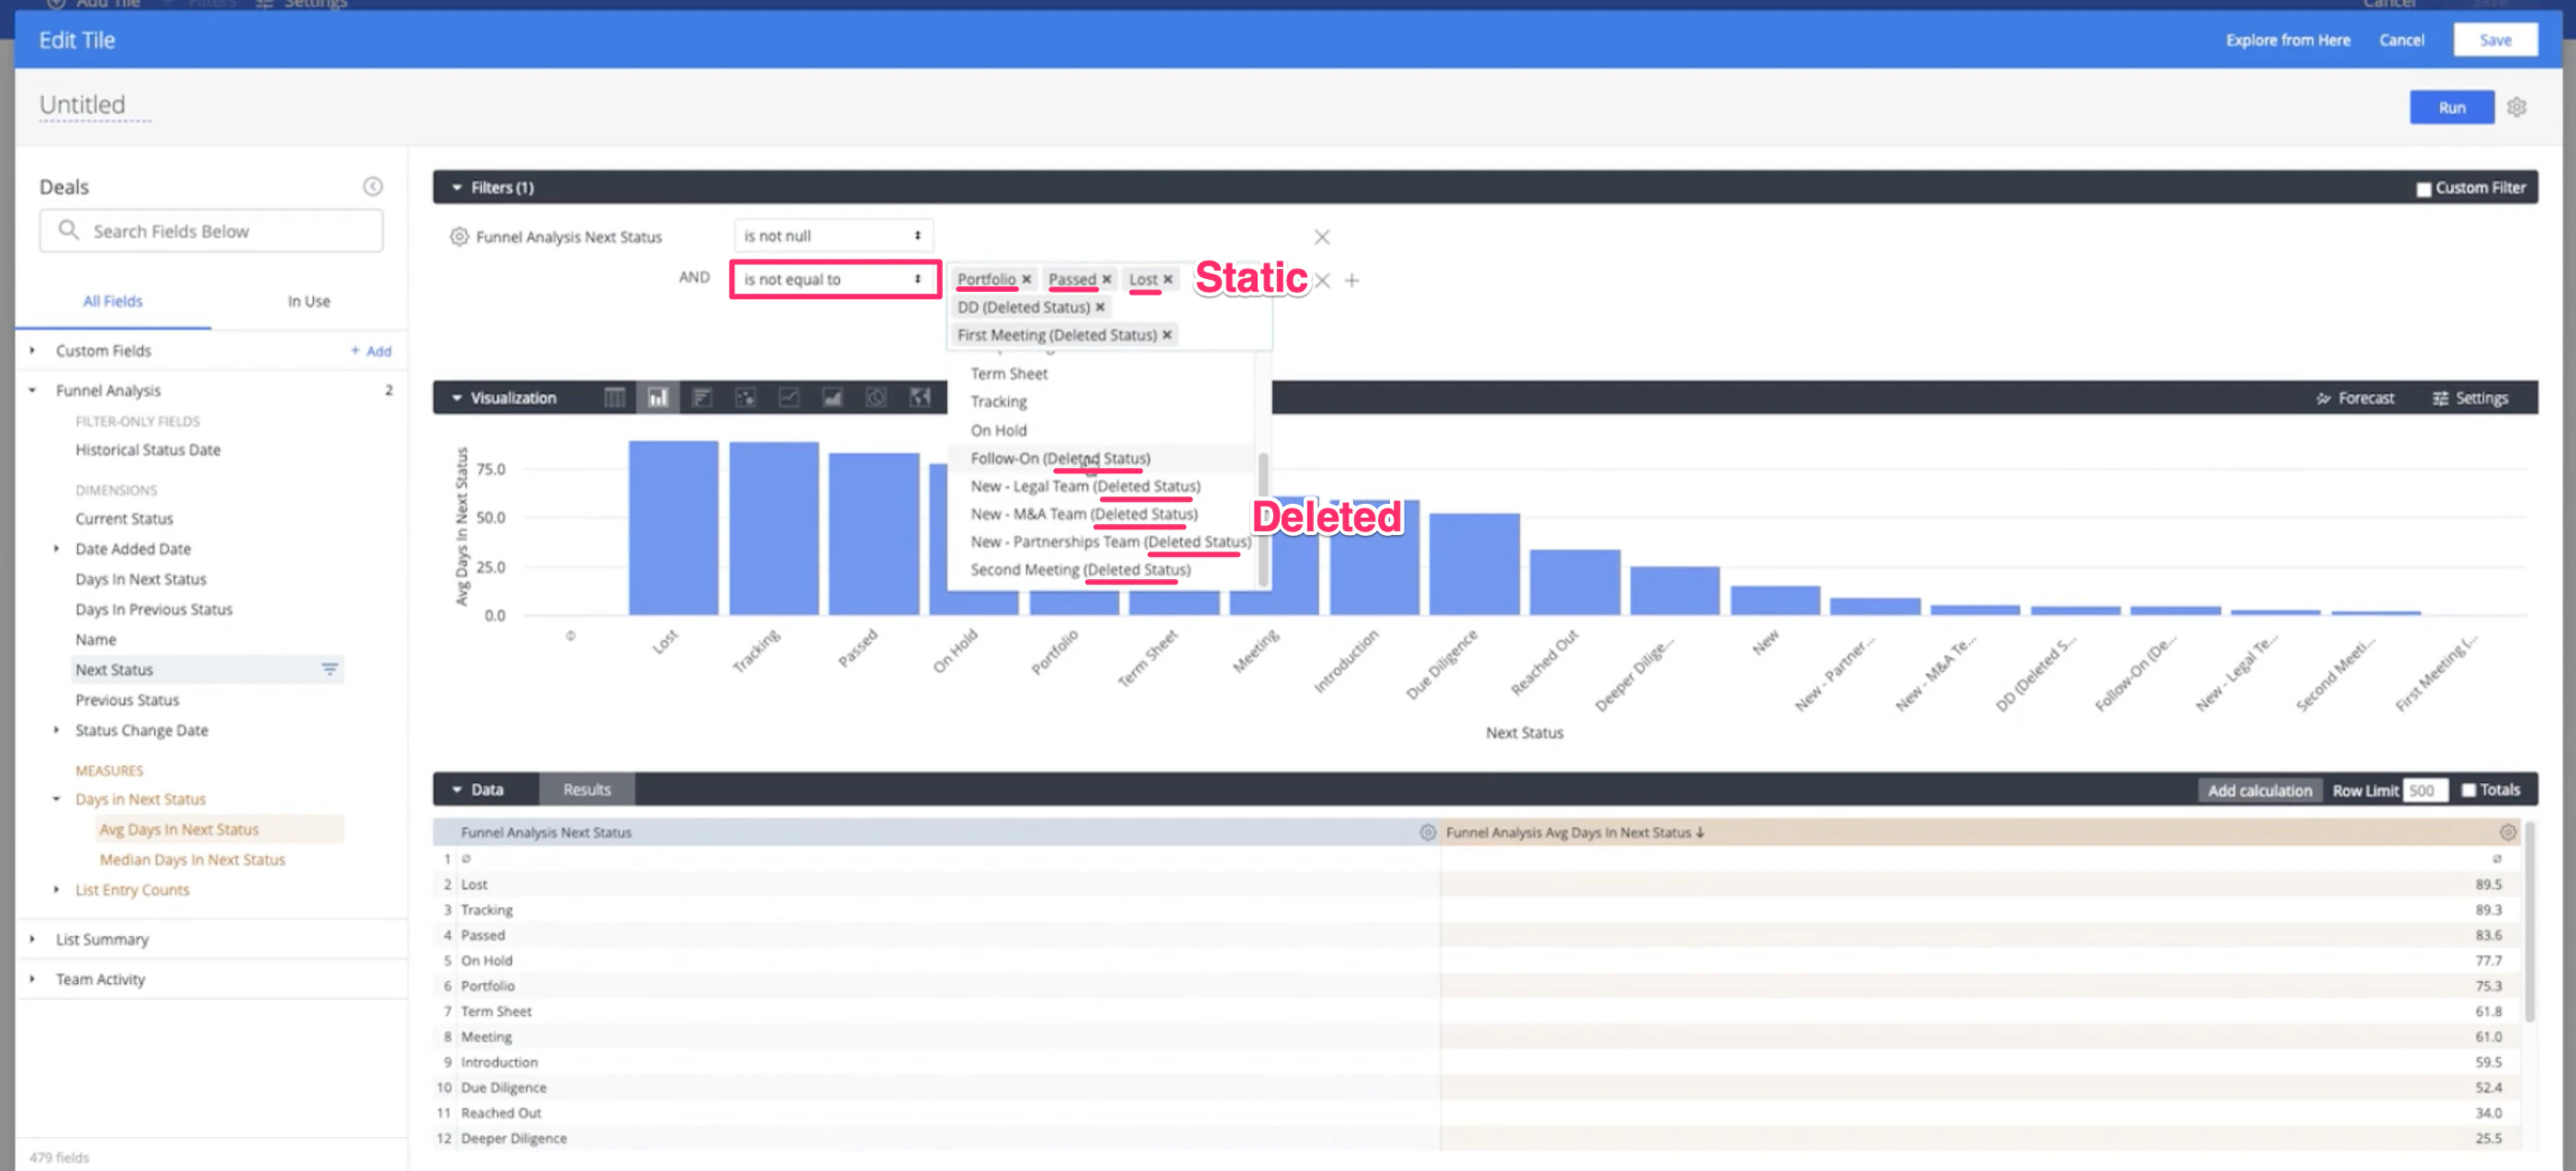
 6. Make sure to also filter out **deleted statuses** and **static statuses** in the **Next Status** dimension.
1\.
**Deleted statuses**: These will appear for historical deals, but they aren't relevant to optimizing your current process.
2\. **Static statuses** (Lost, Won, or Passed): Once you've lost/won or passed on a deal, the time in that particular status no longer matters.
6. Make sure to also filter out **deleted statuses** and **static statuses** in the **Next Status** dimension.
1\.
**Deleted statuses**: These will appear for historical deals, but they aren't relevant to optimizing your current process.
2\. **Static statuses** (Lost, Won, or Passed): Once you've lost/won or passed on a deal, the time in that particular status no longer matters.
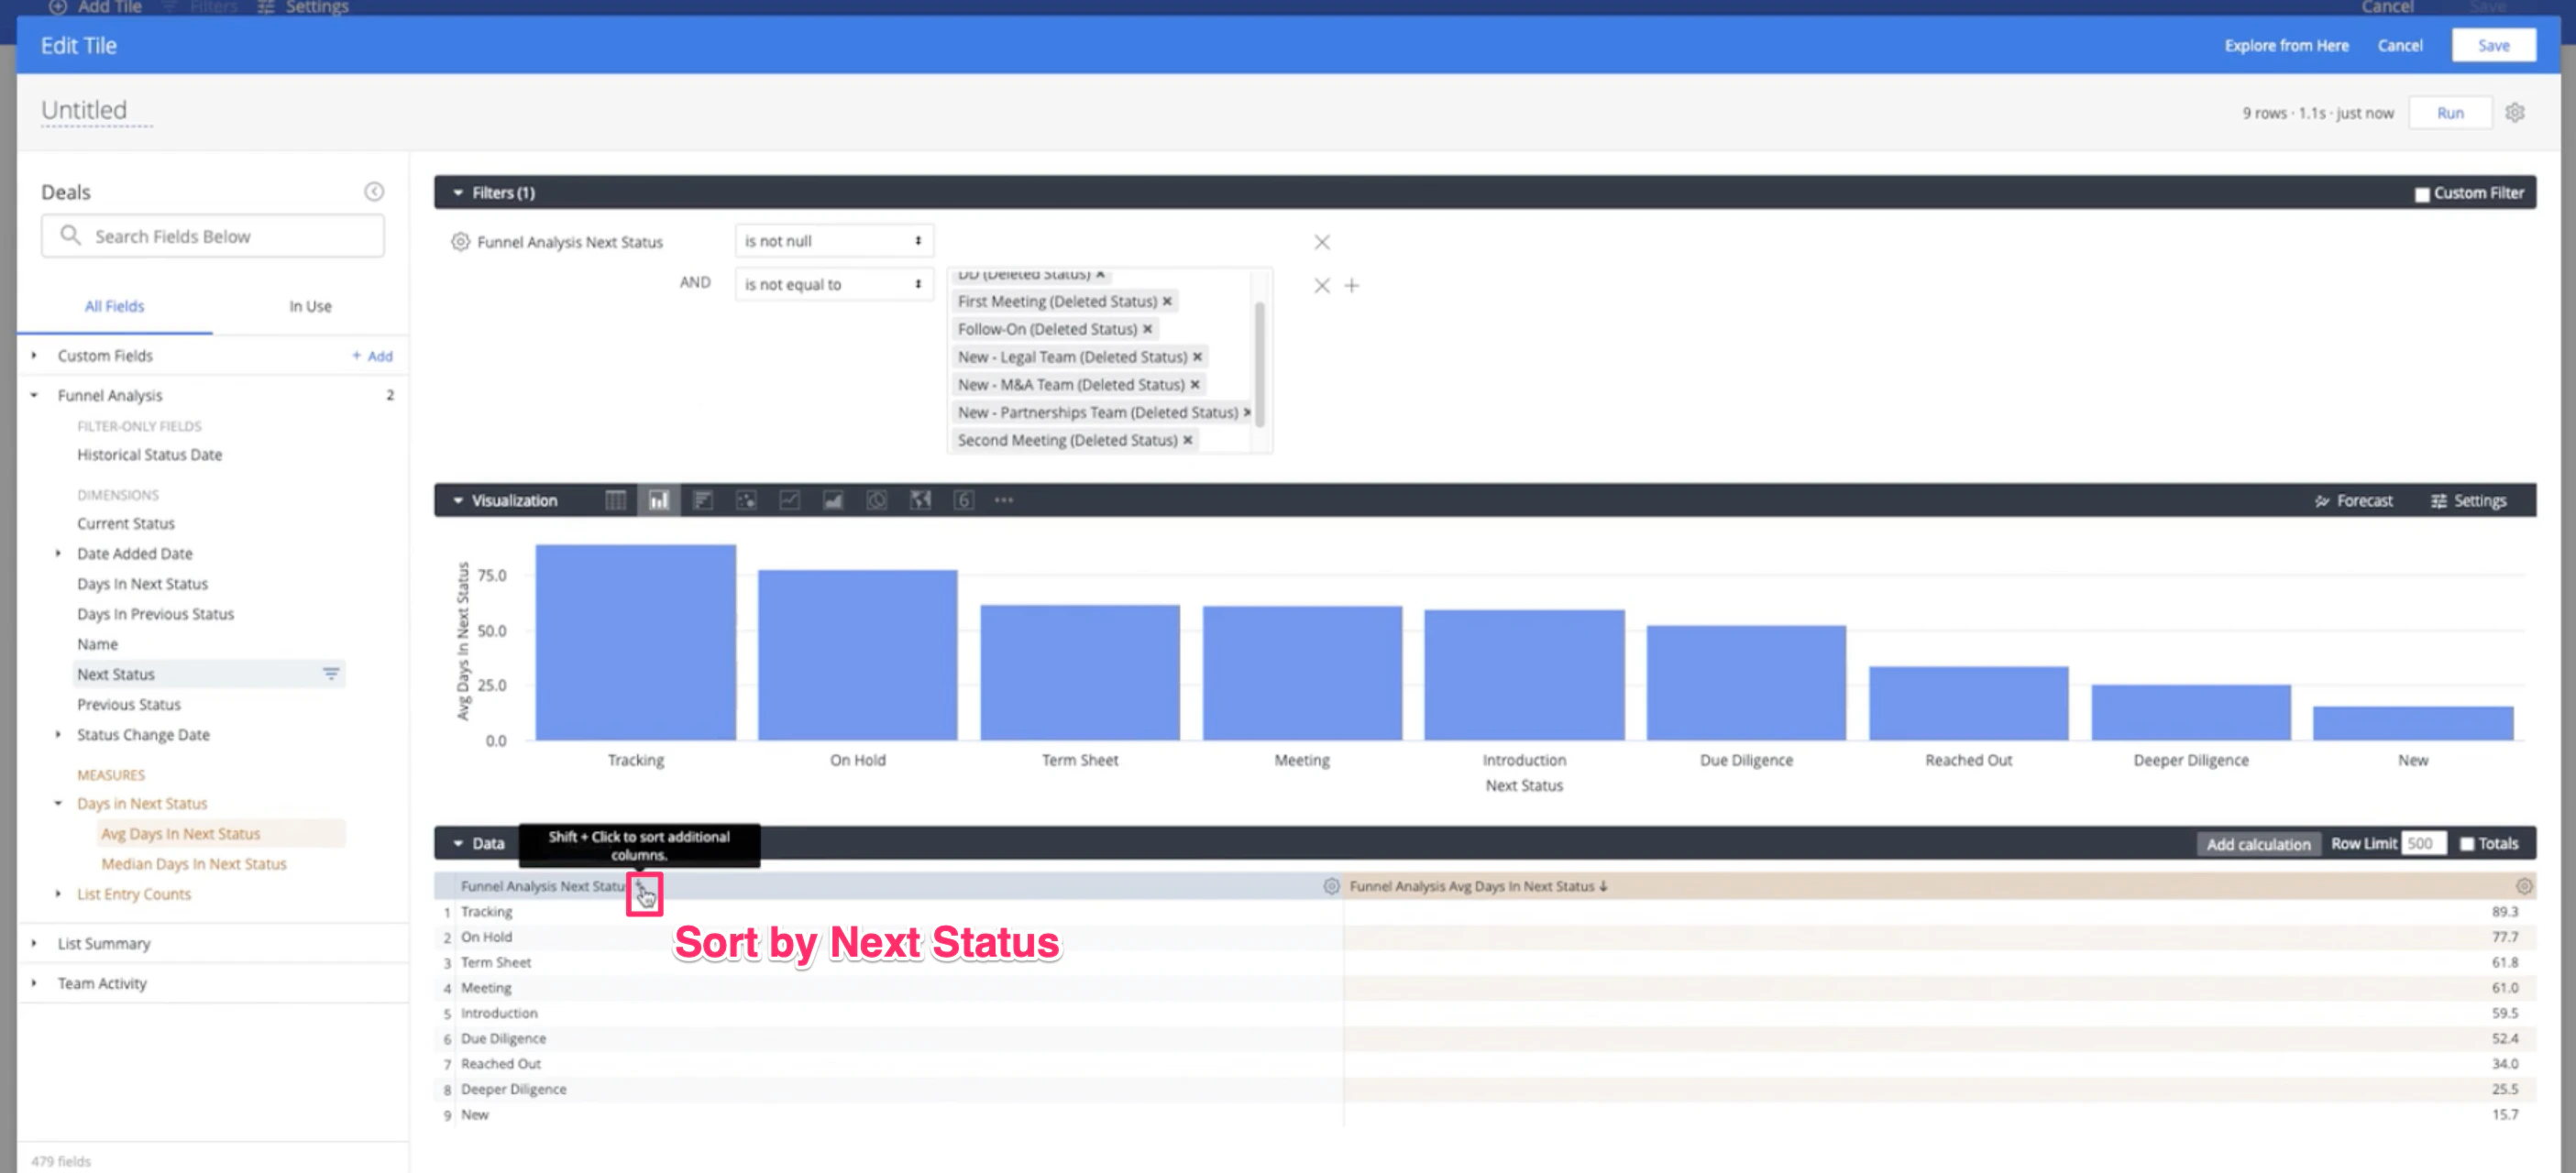
 7. Sort the **Next Status** dimension from first to last. This will sort the statuses in the **Open** category by the order that has been set in the default **Status** column.
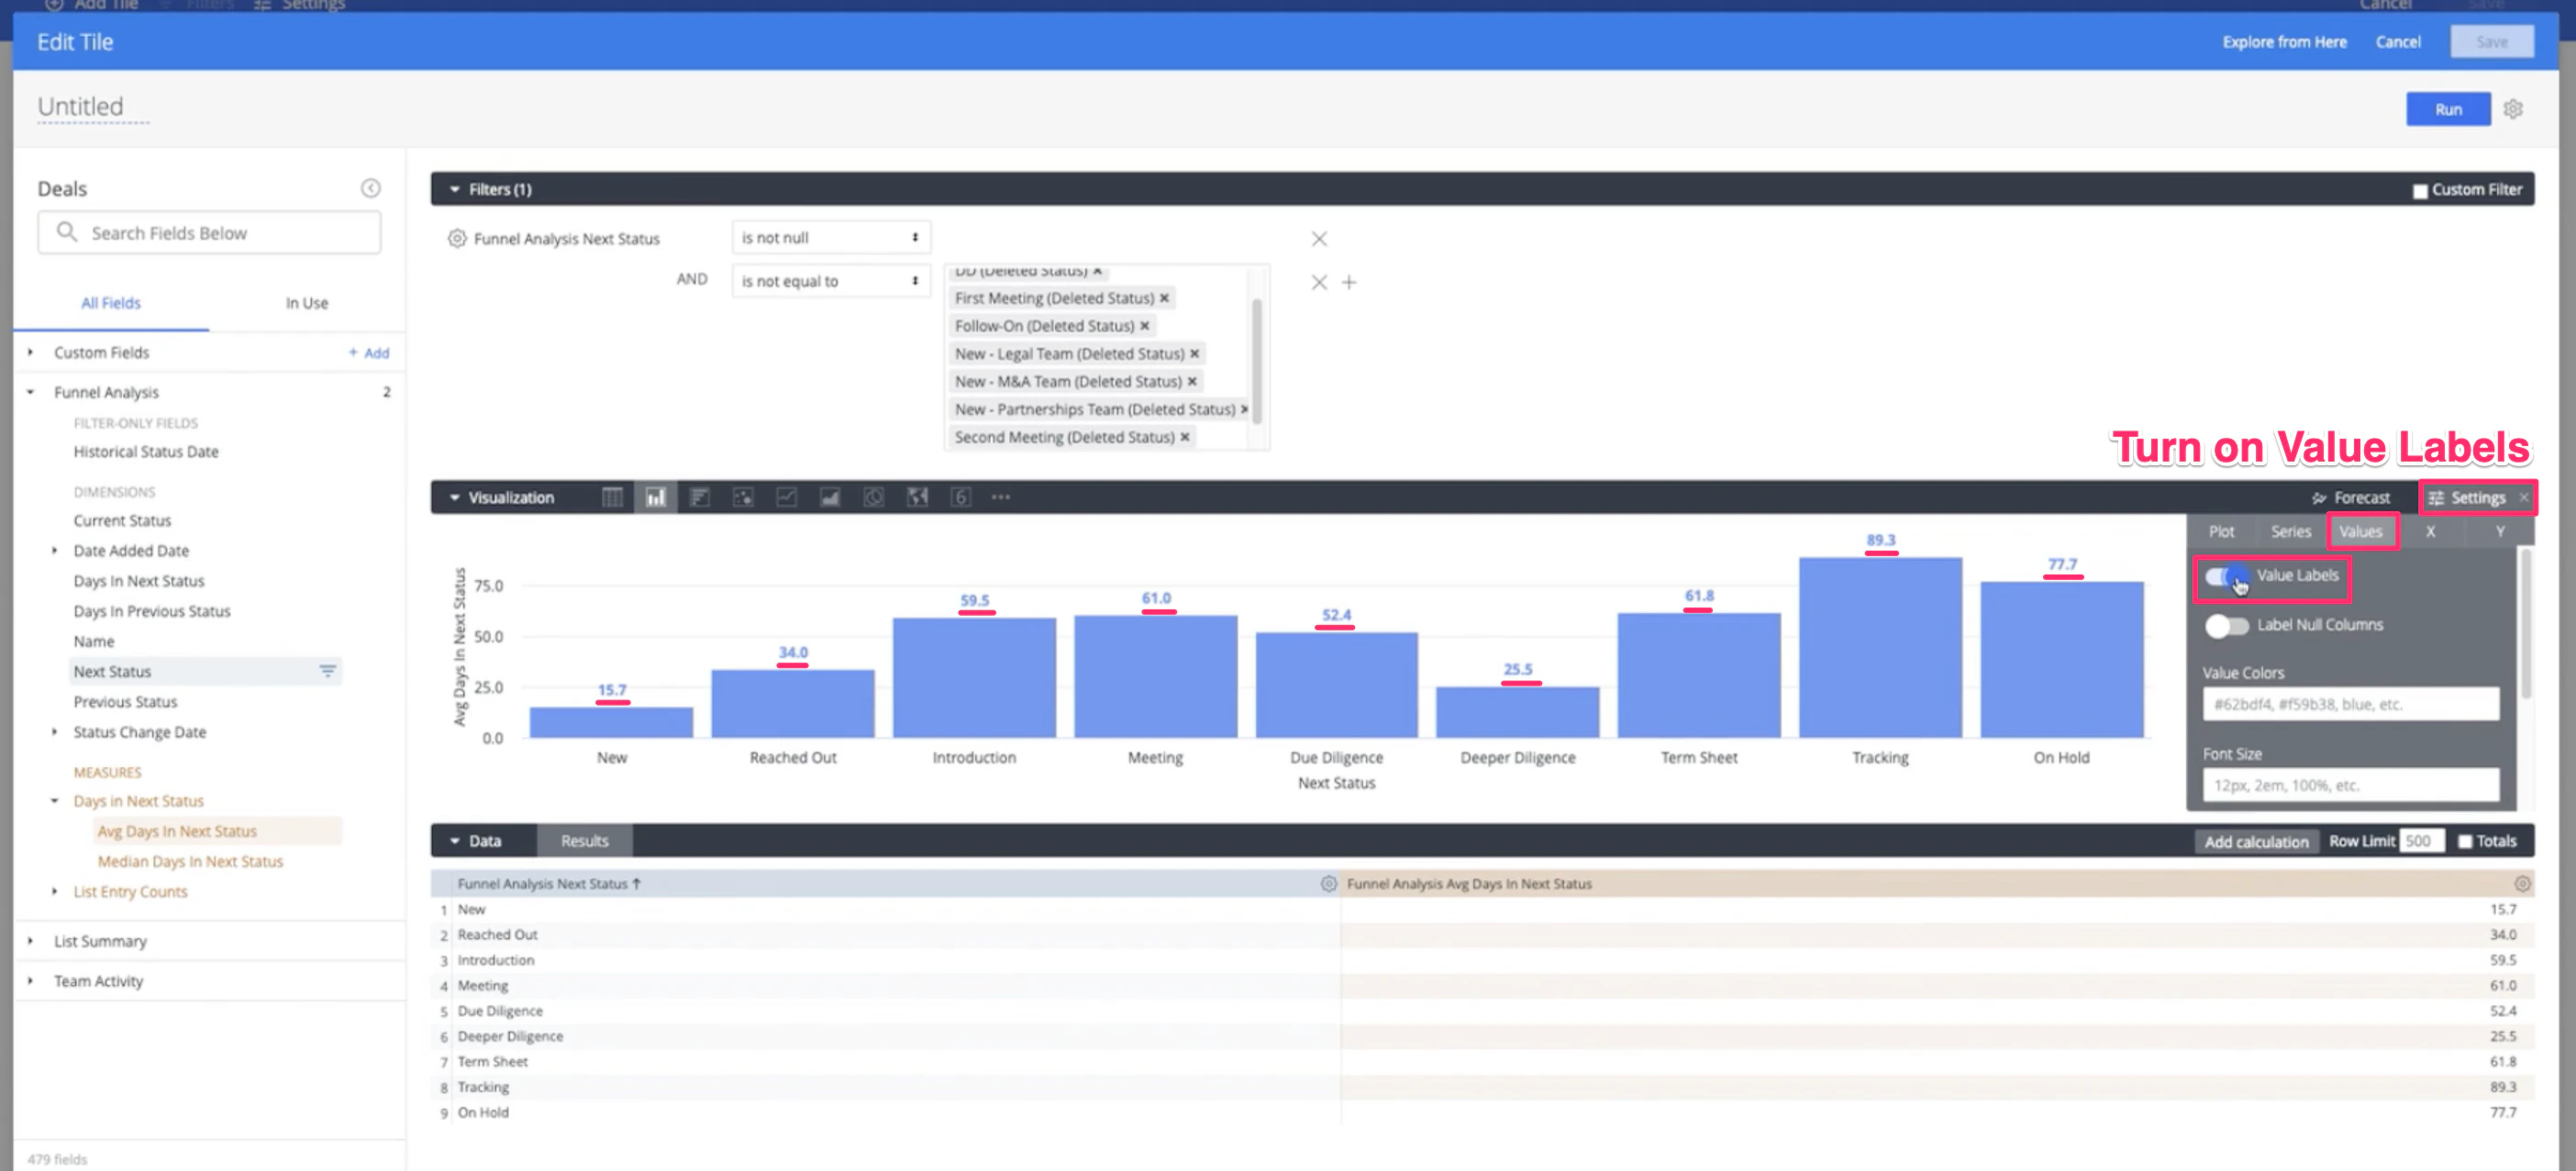
 8. Click on **Settings** within the **Visualization** section, then click the **Values** tab to Add value labels.
 9. Name your visualization, then click **Save**.
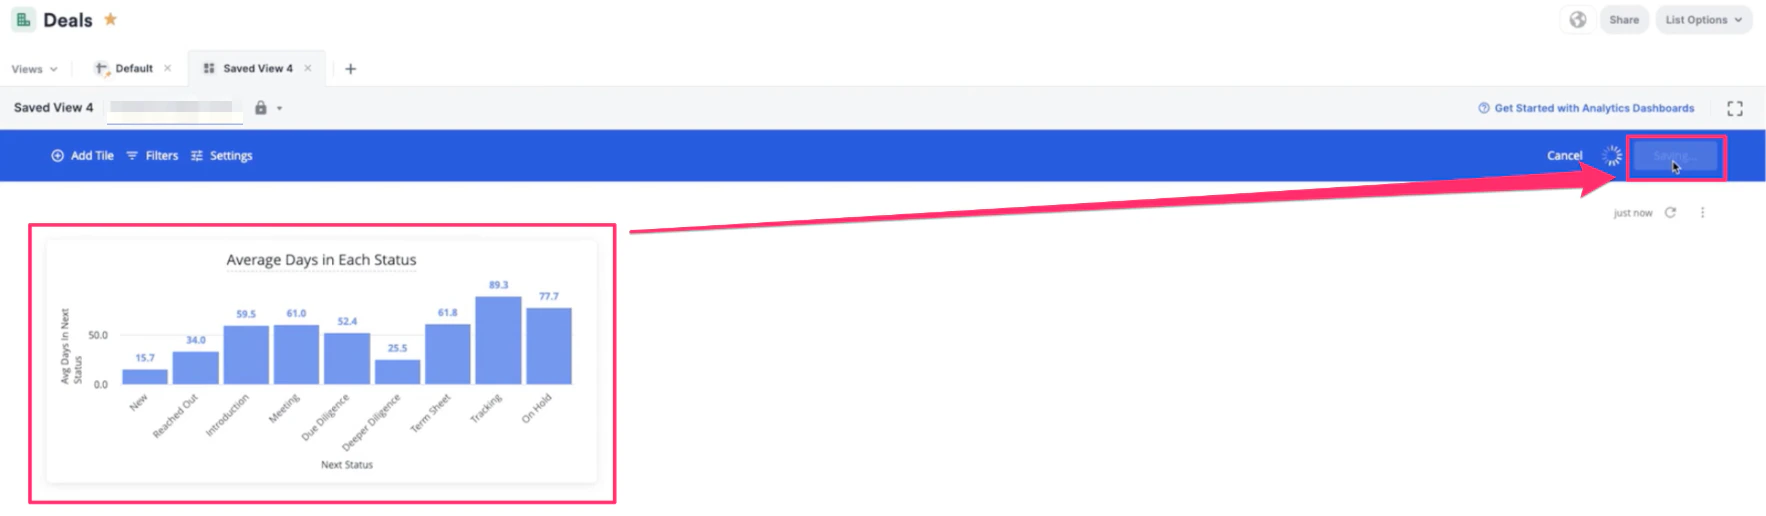
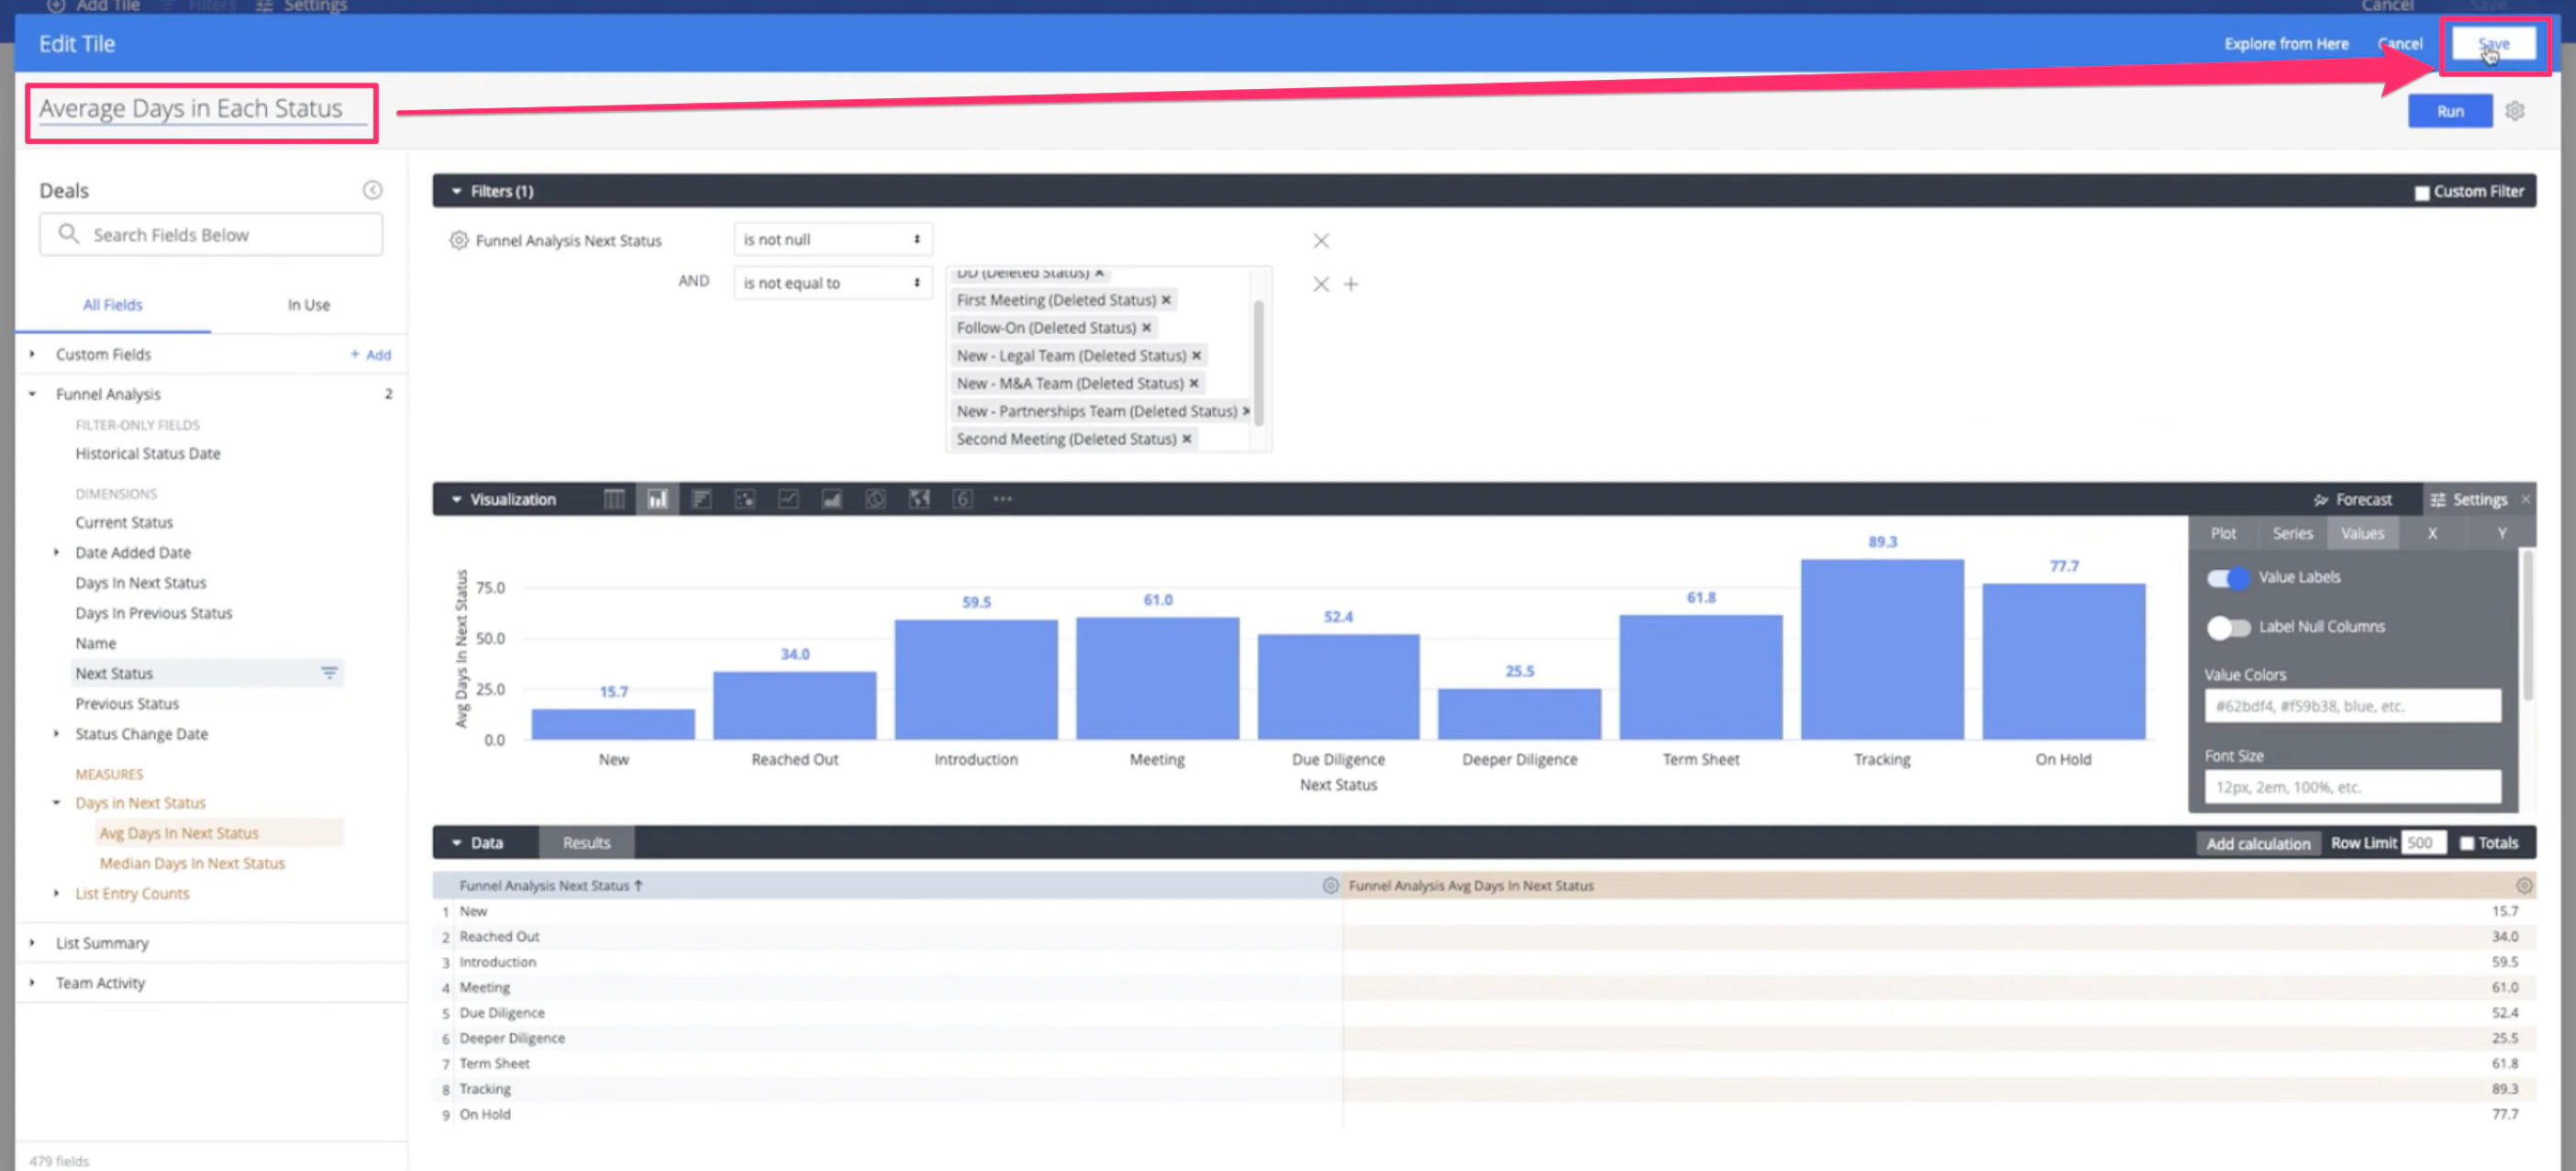 10. Now, you'll see what stages of the pipeline you/your team are spending the most time in and can improve upon moving forward. Click **Save** one more time for your entire dashboard view, and you're all set!