> ## Documentation Index
> Fetch the complete documentation index at: https://support.affinity.co/llms.txt
> Use this file to discover all available pages before exploring further.
# How To Set And Track Goals Using Affinity Analytics
> Help center reference
**How-to** — task-oriented recipe.
To understand how close you and your team members are towards completing certain metrics, you can create and track goals with Affinity Analytics.
**Note**: This video contains the old navigation bar on the top, whereas the current navigation bar now lies on the left side of your screen. While the remaining content is still the same, rest assured that we will be updating our videos accordingly. You can also follow this step-by-step guide below:
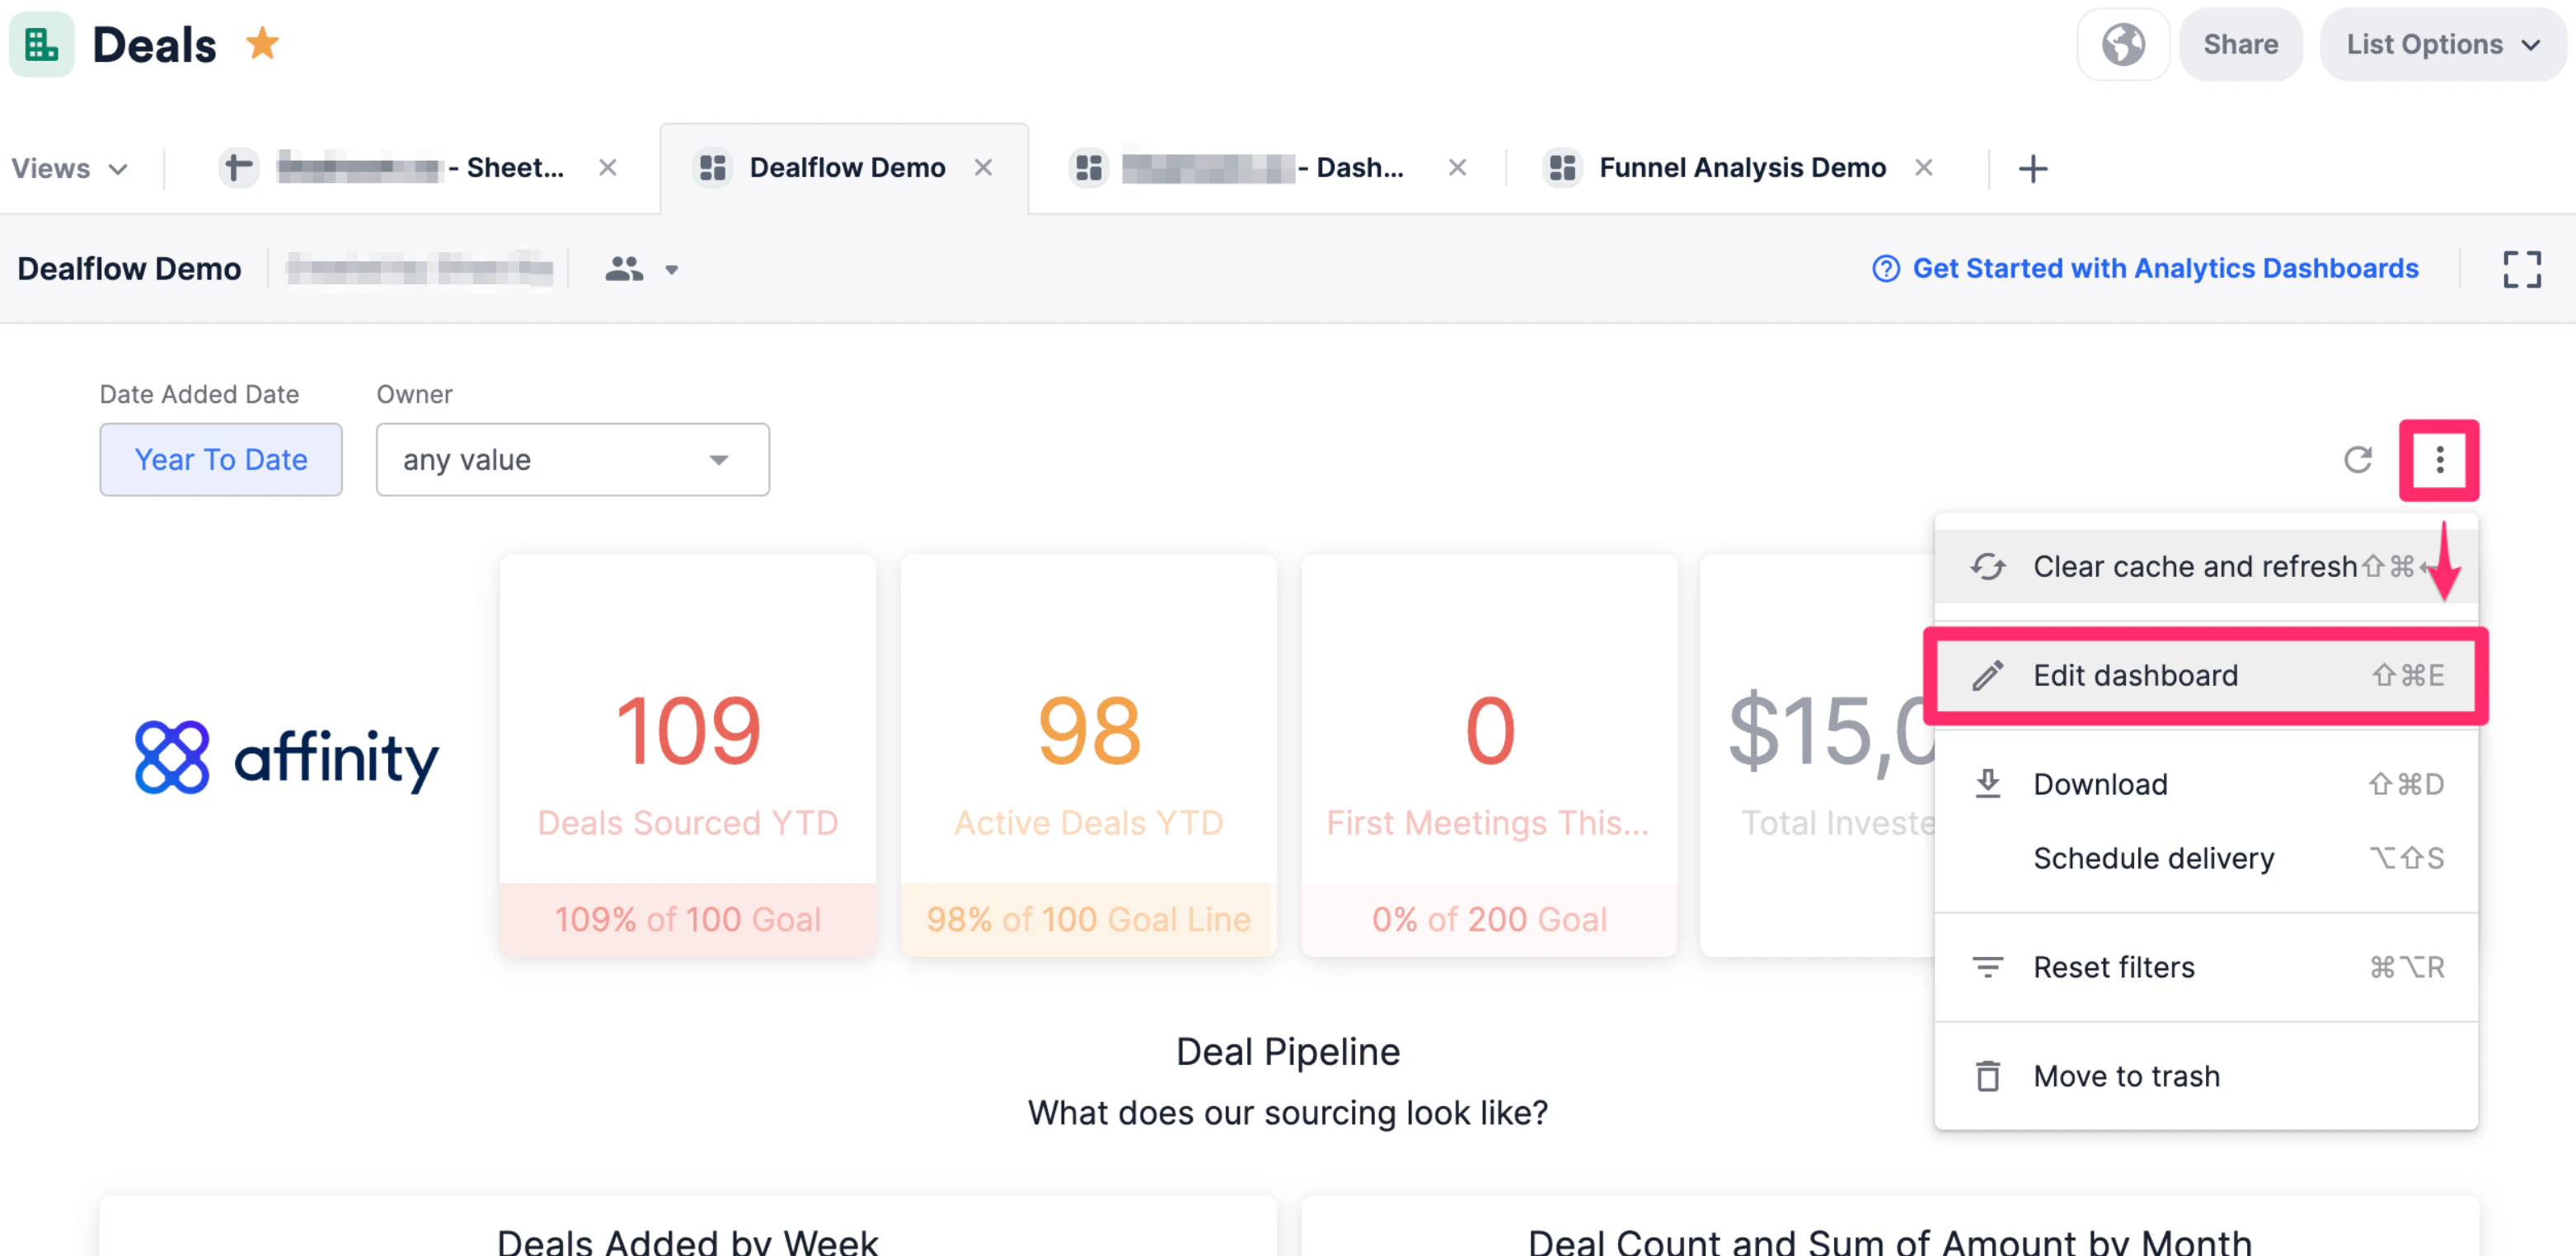
1. Click into the dashboard view you'd like to create this new tile on. Then, click the **ellipsis** (3 dotted icon) and click **Edit dashboard**.
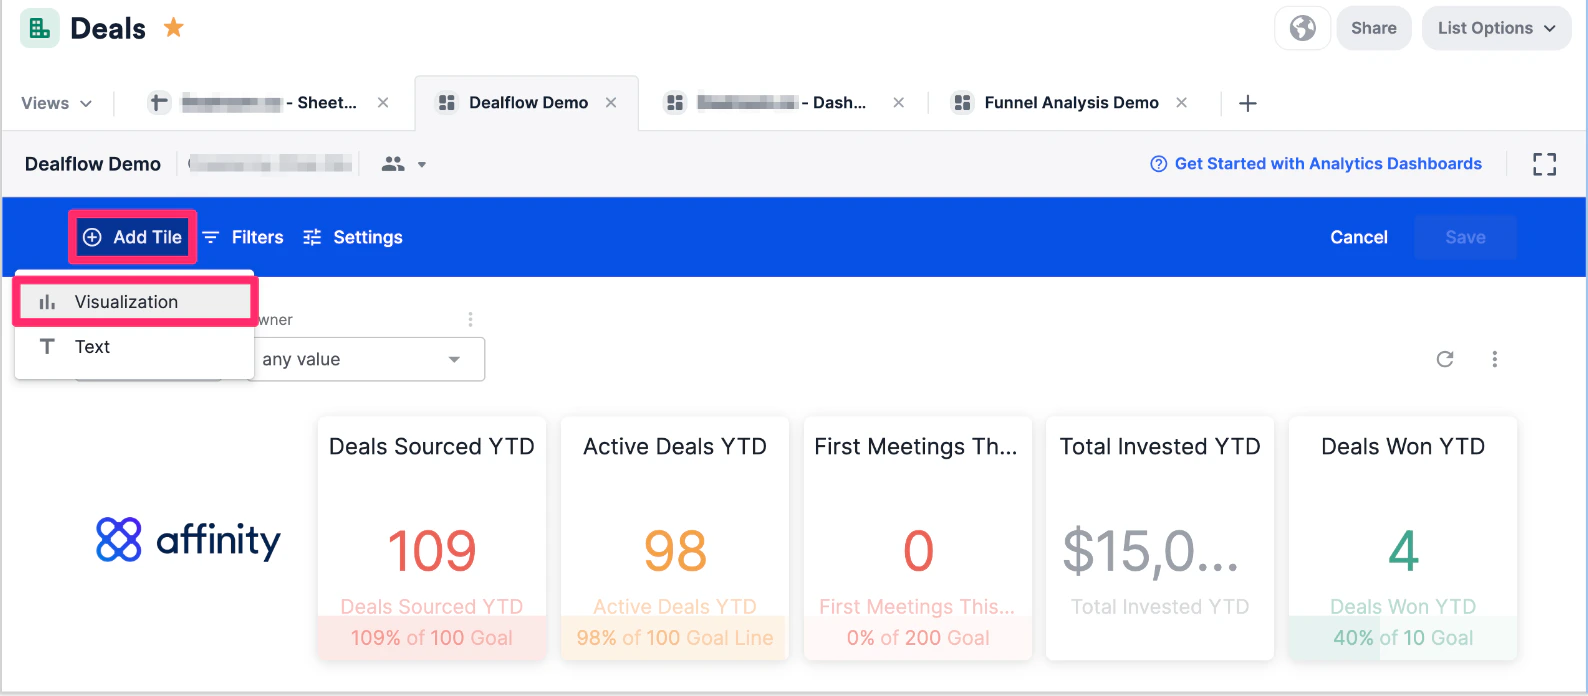
 2. Click **Add Tile** to create a new **Visualization** tile.
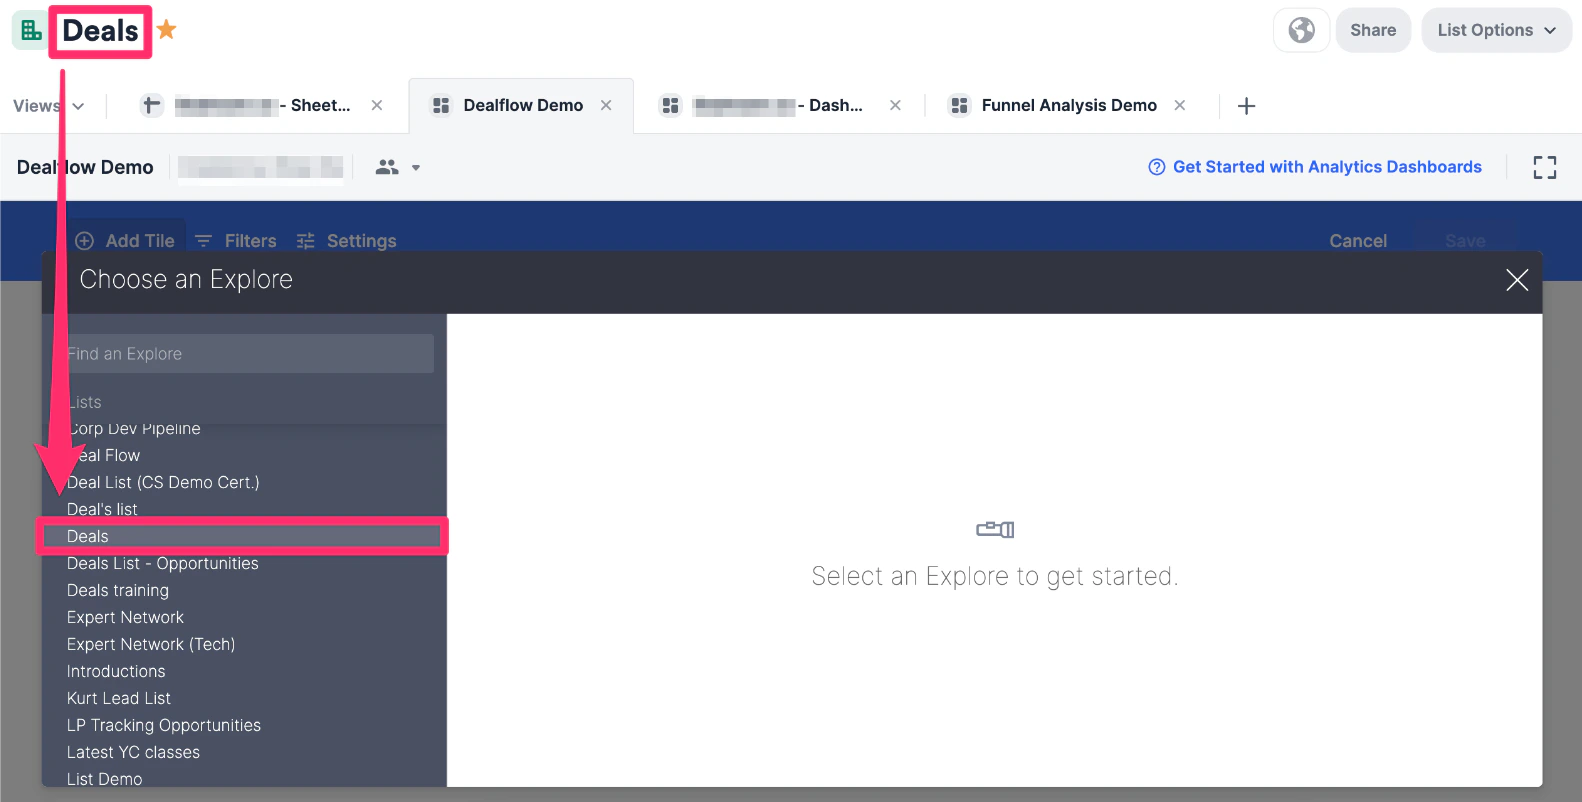
 3. Once the **Choose an Explore** modal opens up, select the list you're currently on.
 4. Within the **List Summary** section on the left side, select **Count of Organizations** as the measure, then make sure the visualization style is set to **Single Value**.
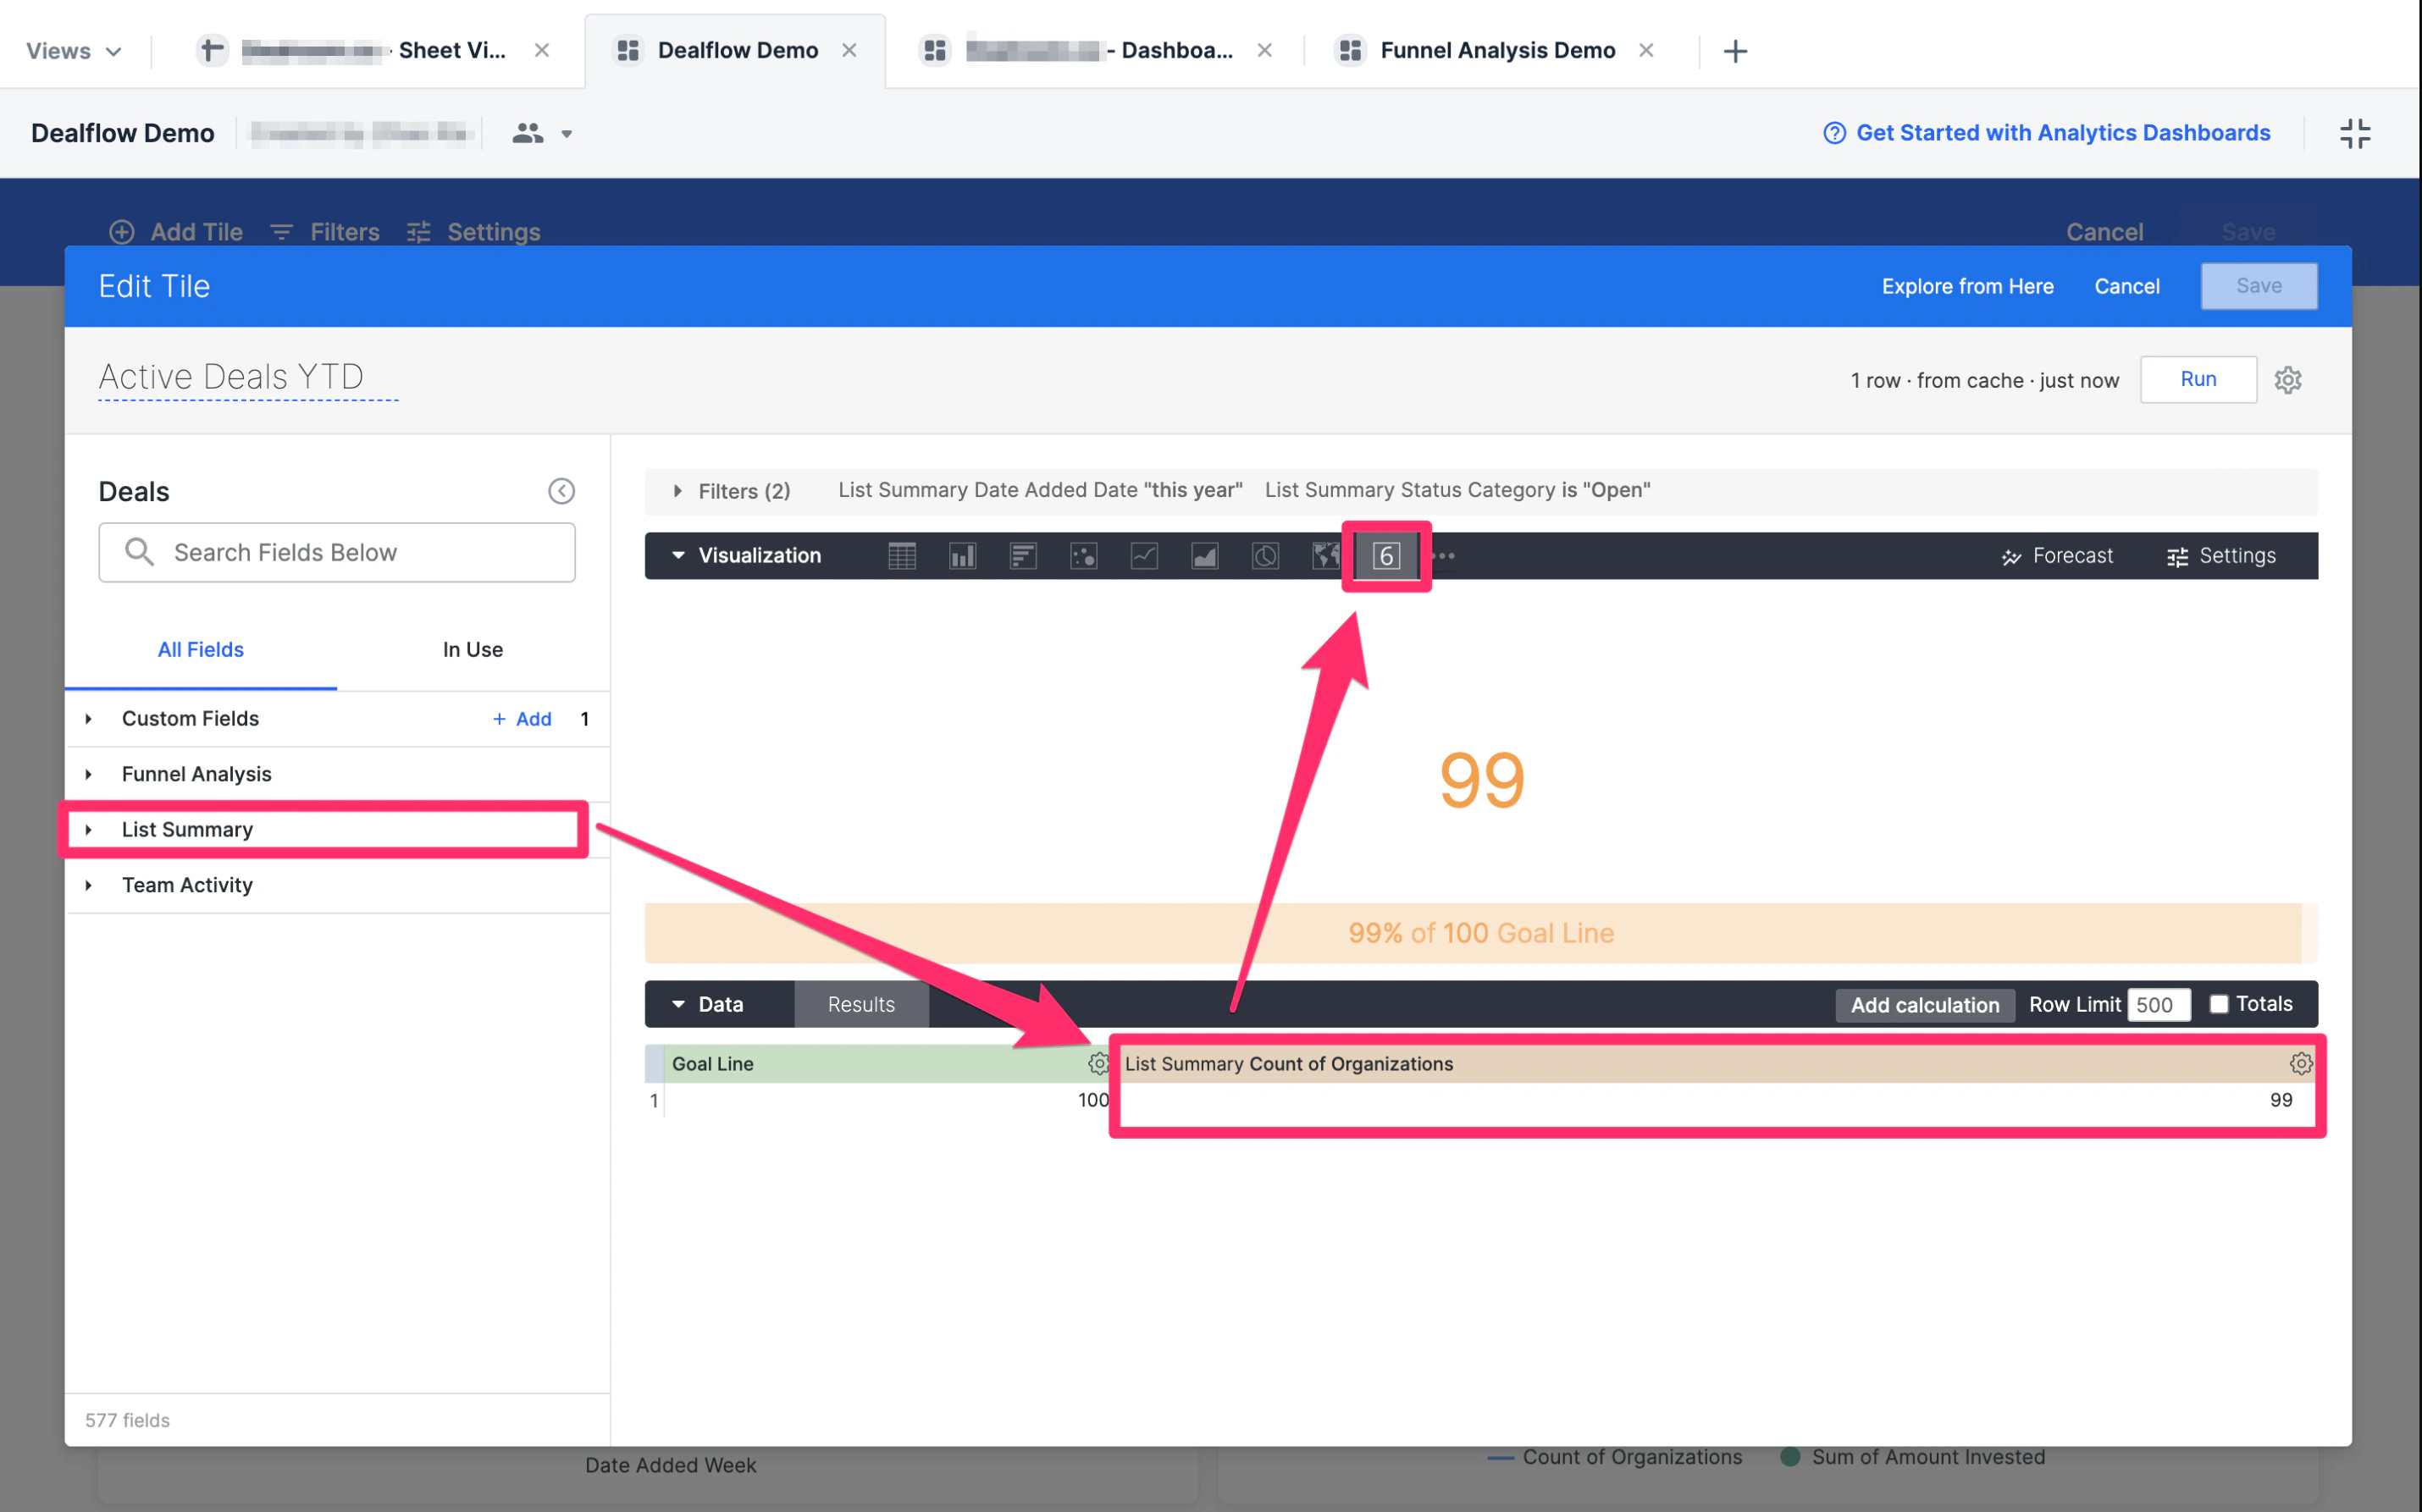 5. Now, click on **+ Add** in the **Custom Fields** section to create a **Table Calculation**.
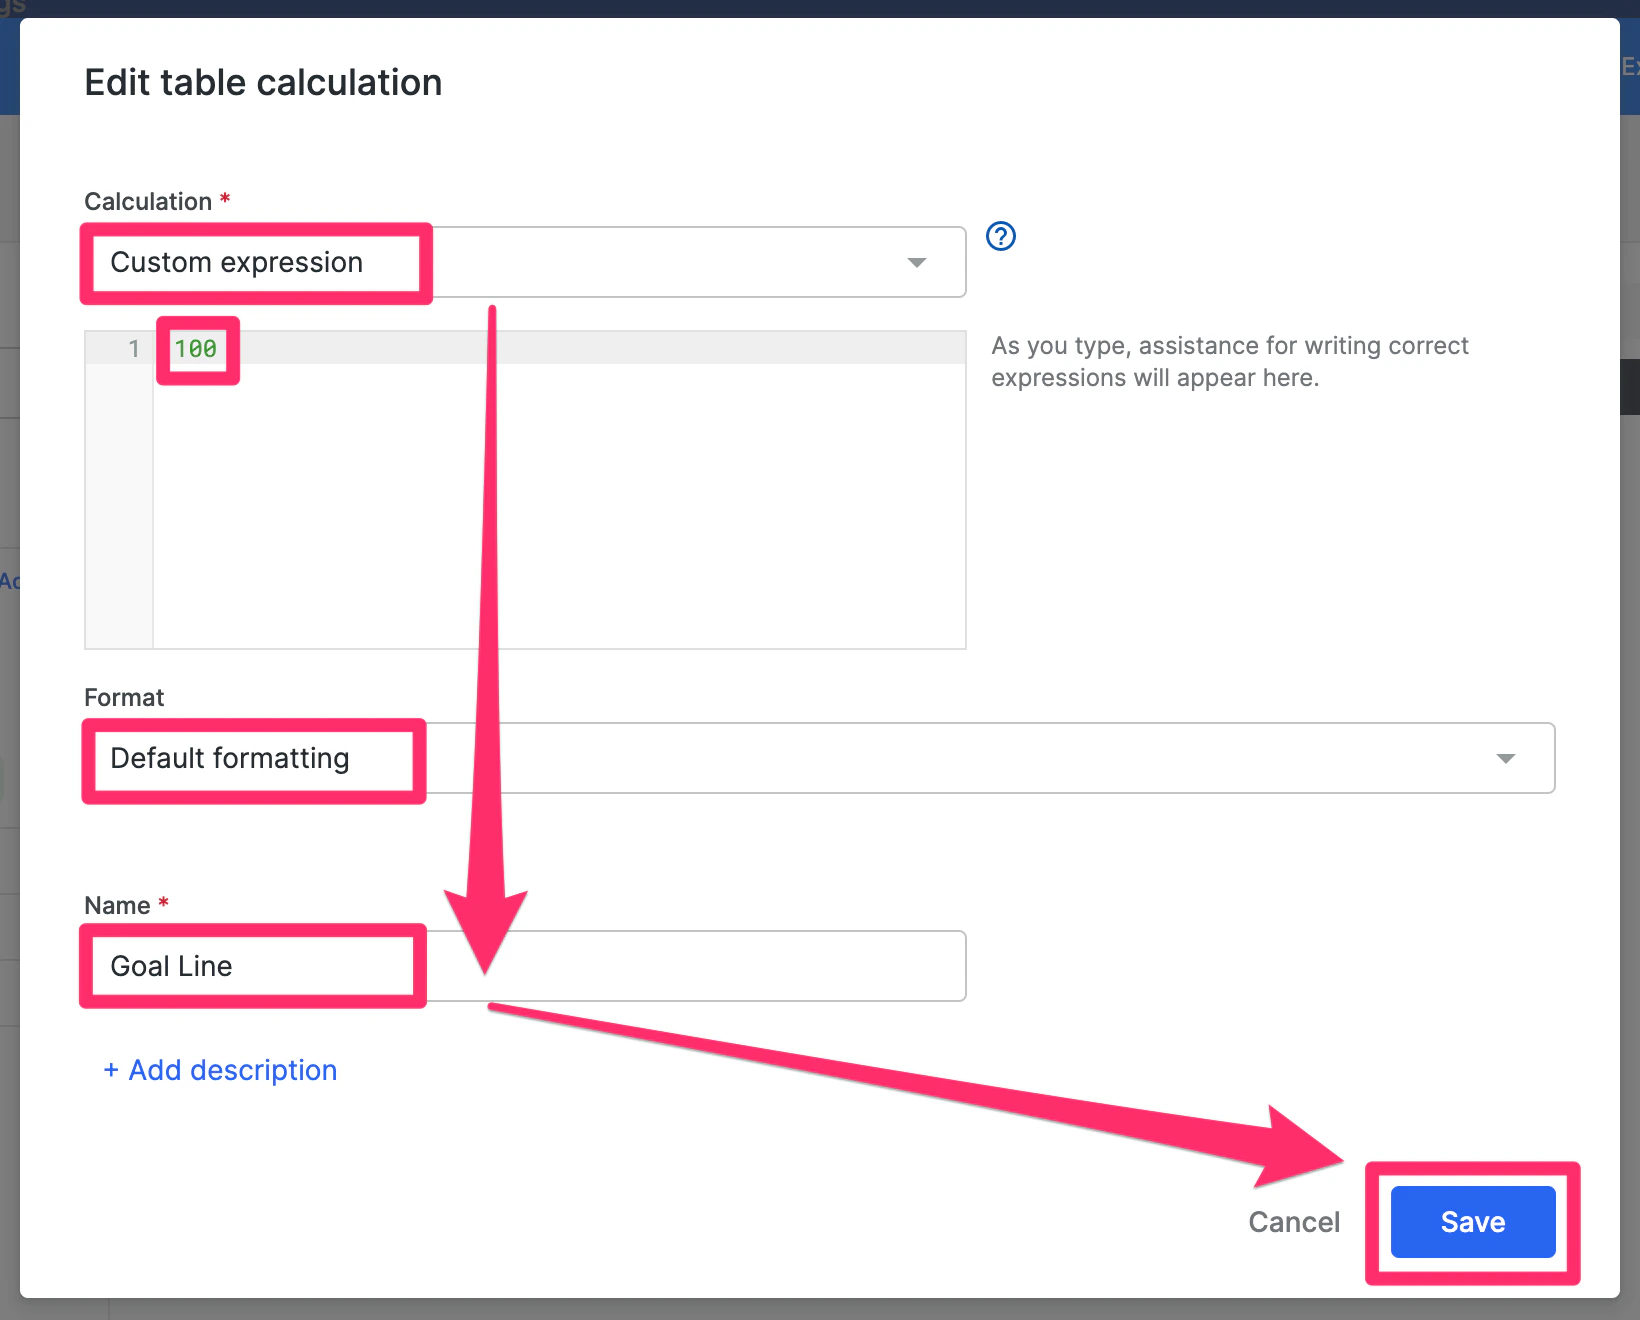
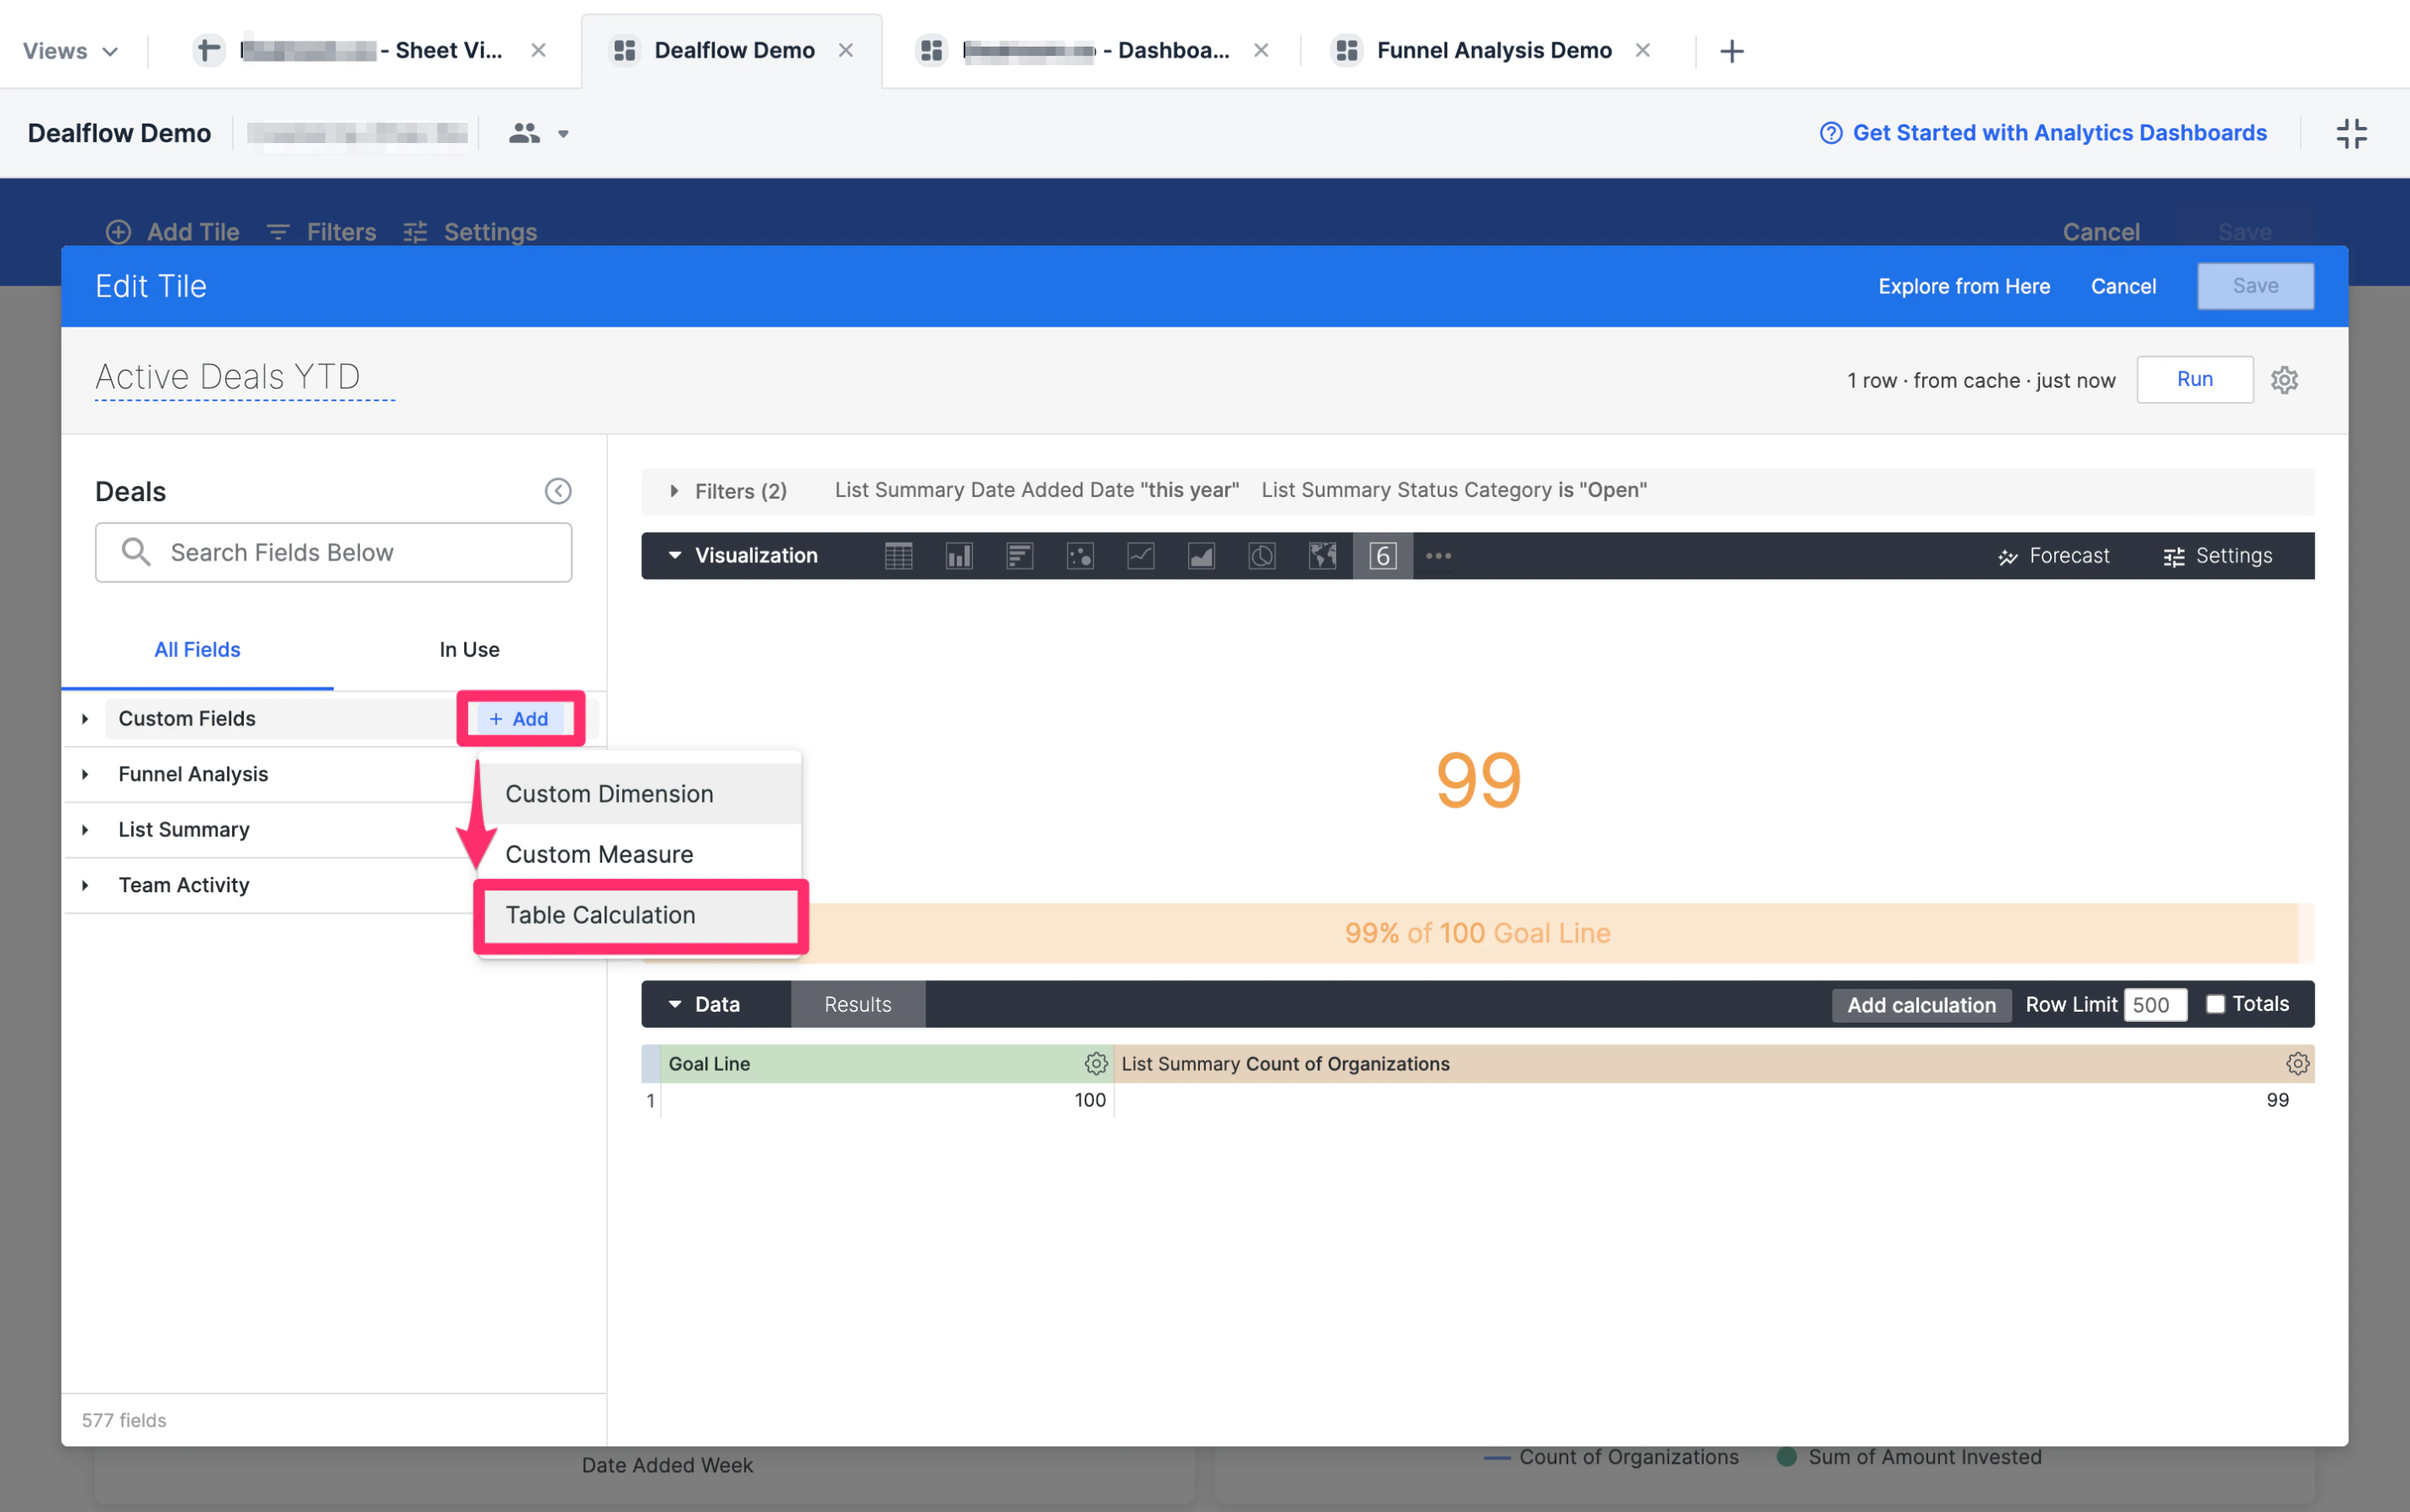 6. Set the **Calculation** field value to **Custom expression**, then add a number in the text box - in this example we'll use **100**. Then, set the **Format** field value to **Default formatting** and create a name for this custom field (i.e. **Goal Line**), then click **Save**.
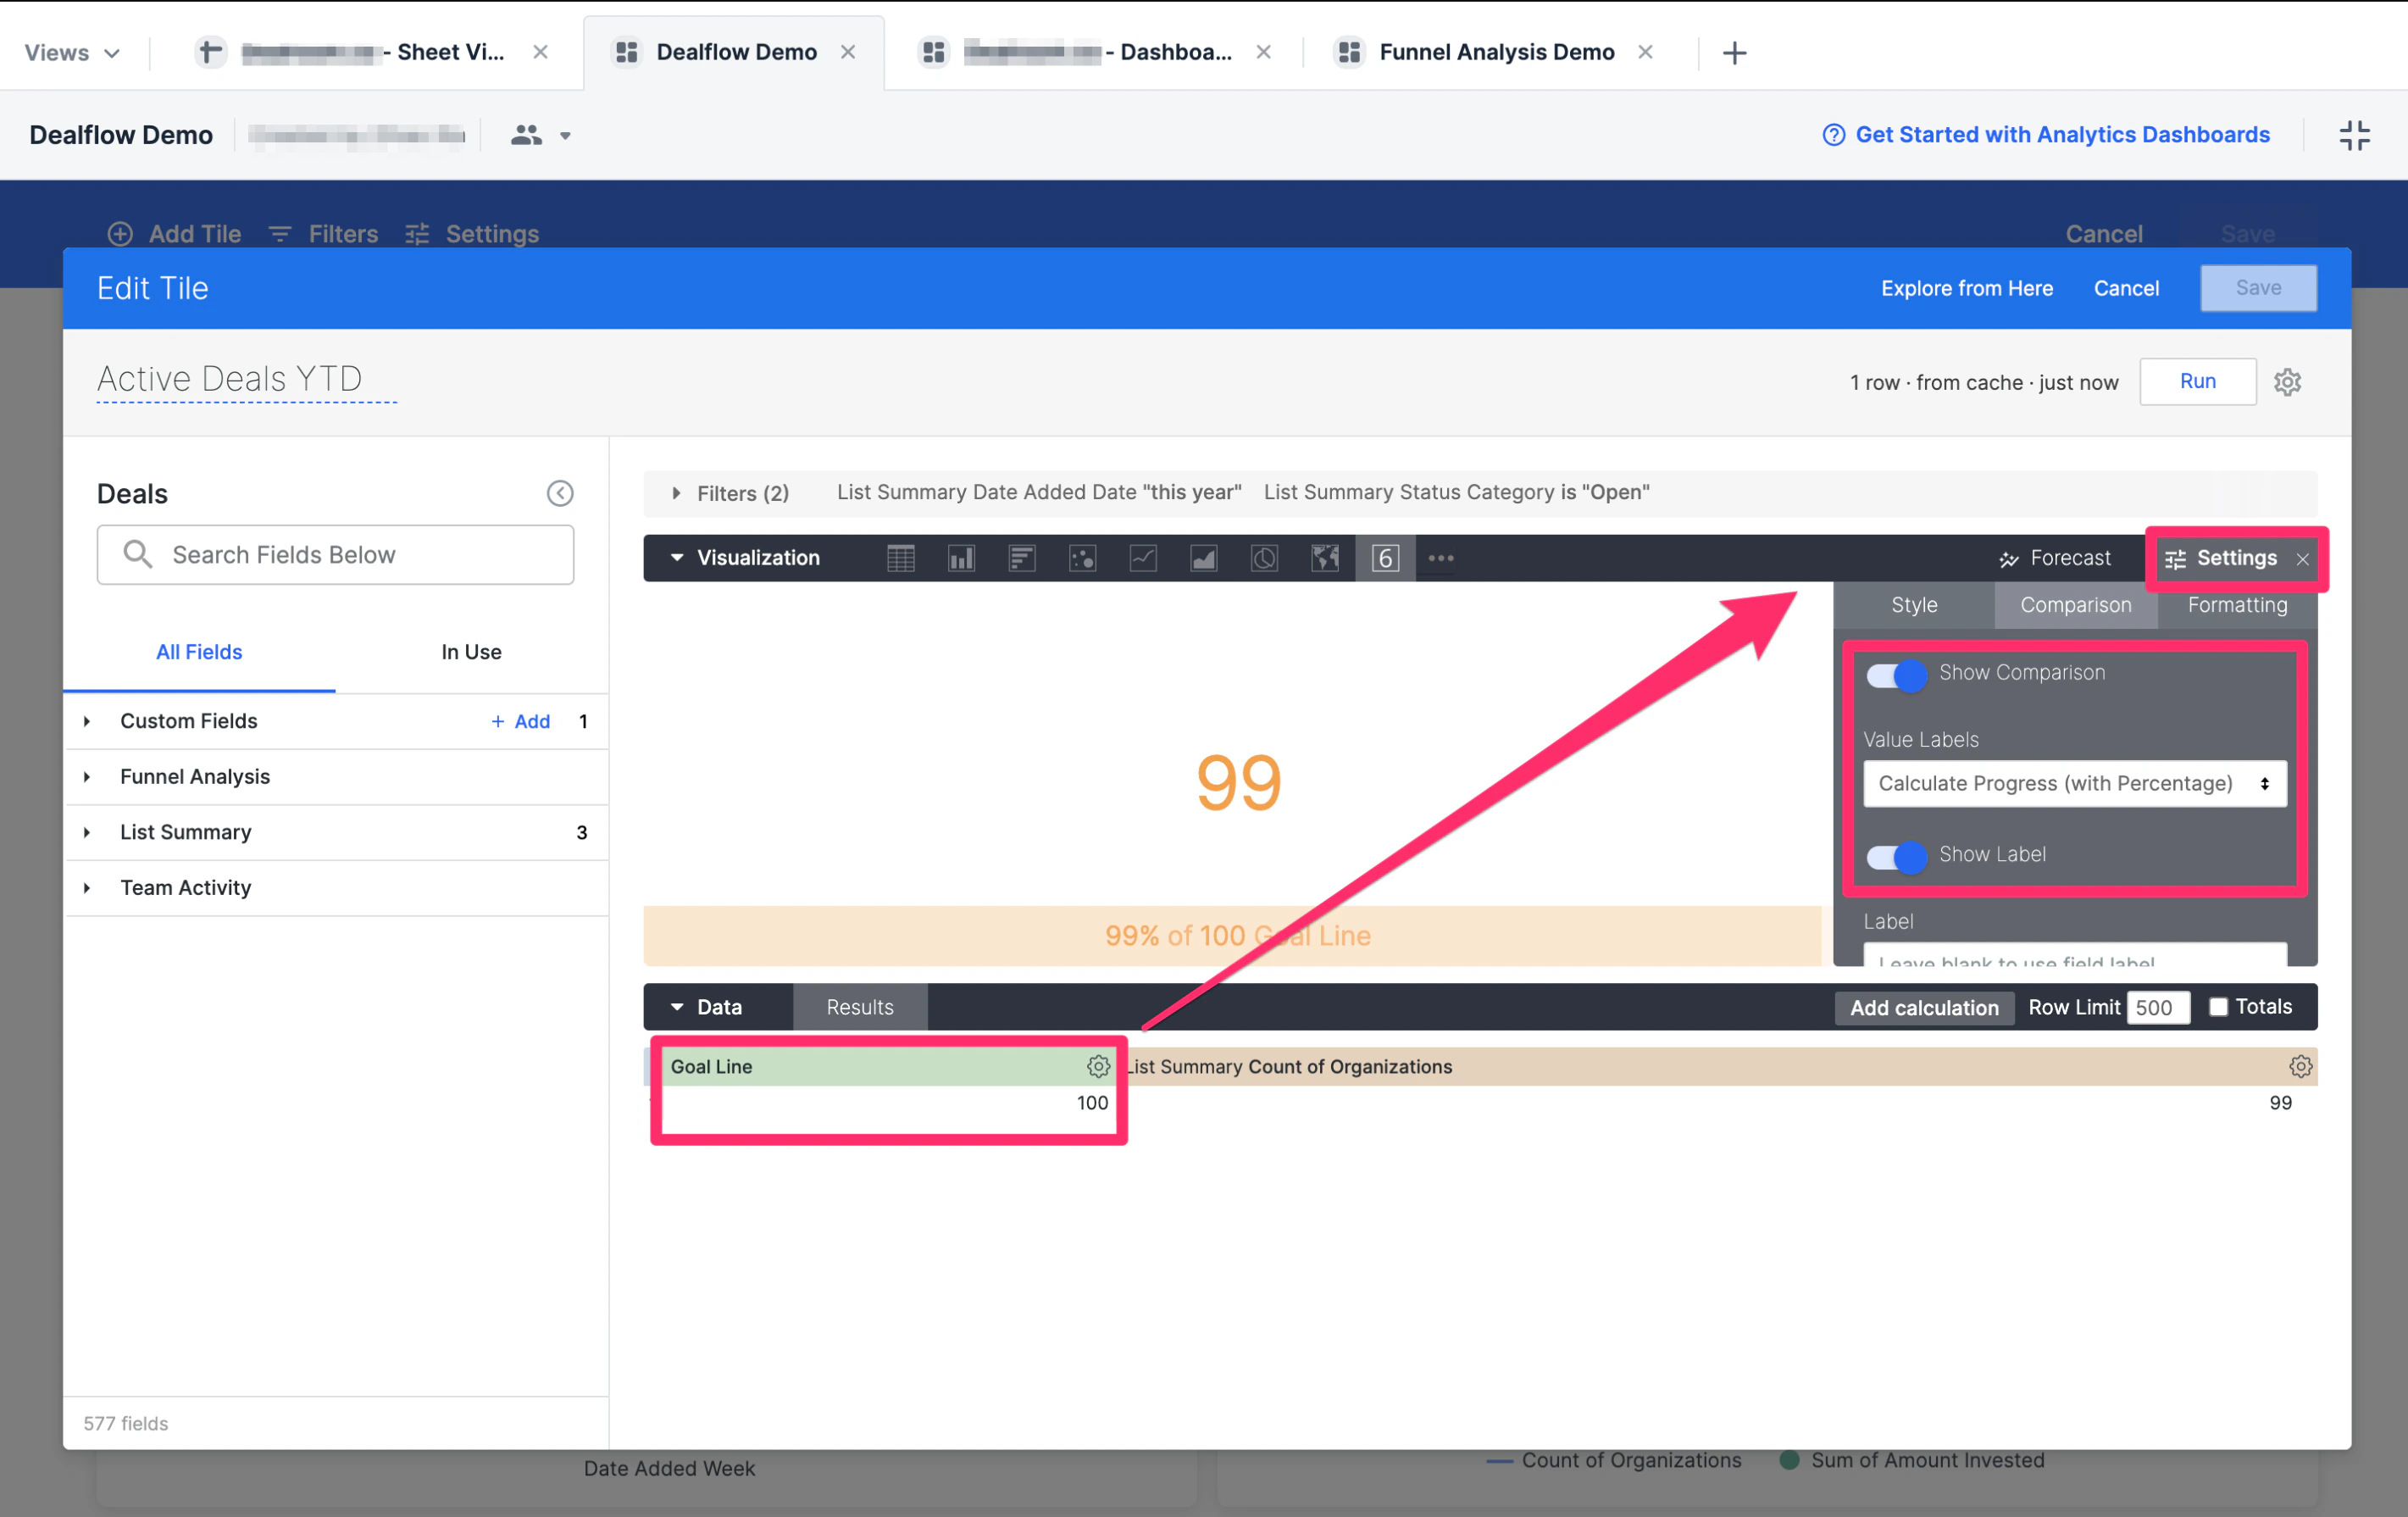
 7. You'll now see your custom field (i.e. **Goal Line**) appear in the **Data** section.
1. Now, click on **Settings** on the right-side of the **Visualization** section, then click on the **Comparison** tab.
2. From there, set the **Value Labels** field value to **Calculate Progress (with Percentage)**, then toggle on **Show Comparison** and **Show Label**.
7. You'll now see your custom field (i.e. **Goal Line**) appear in the **Data** section.
1. Now, click on **Settings** on the right-side of the **Visualization** section, then click on the **Comparison** tab.
2. From there, set the **Value Labels** field value to **Calculate Progress (with Percentage)**, then toggle on **Show Comparison** and **Show Label**.
 8. Click **Run**, then click **Save** to make sure the tile is created.
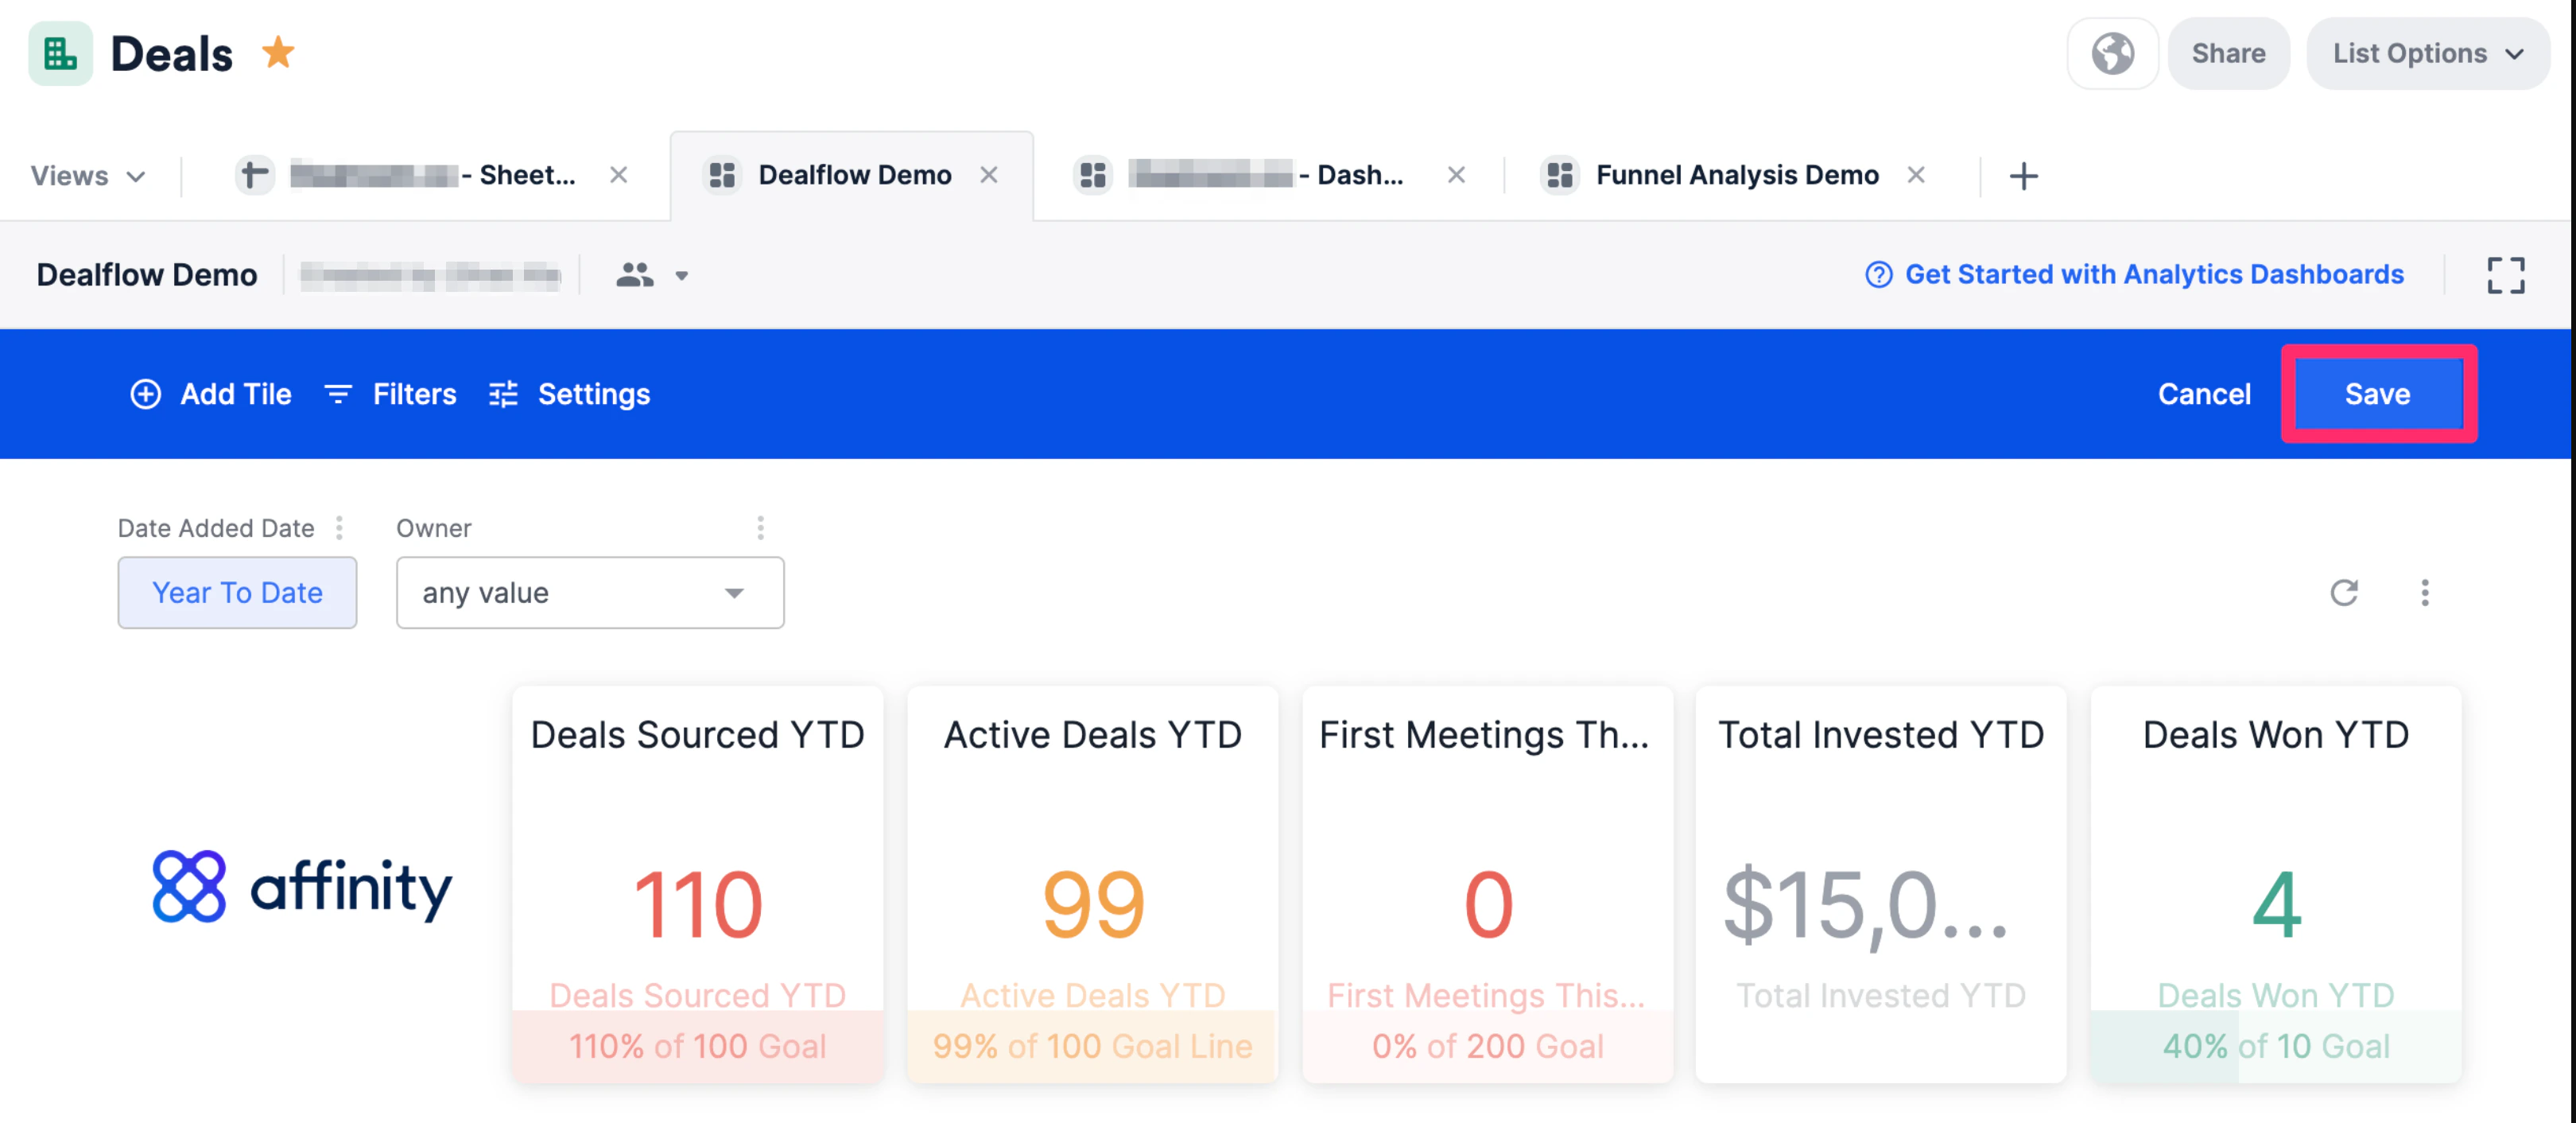
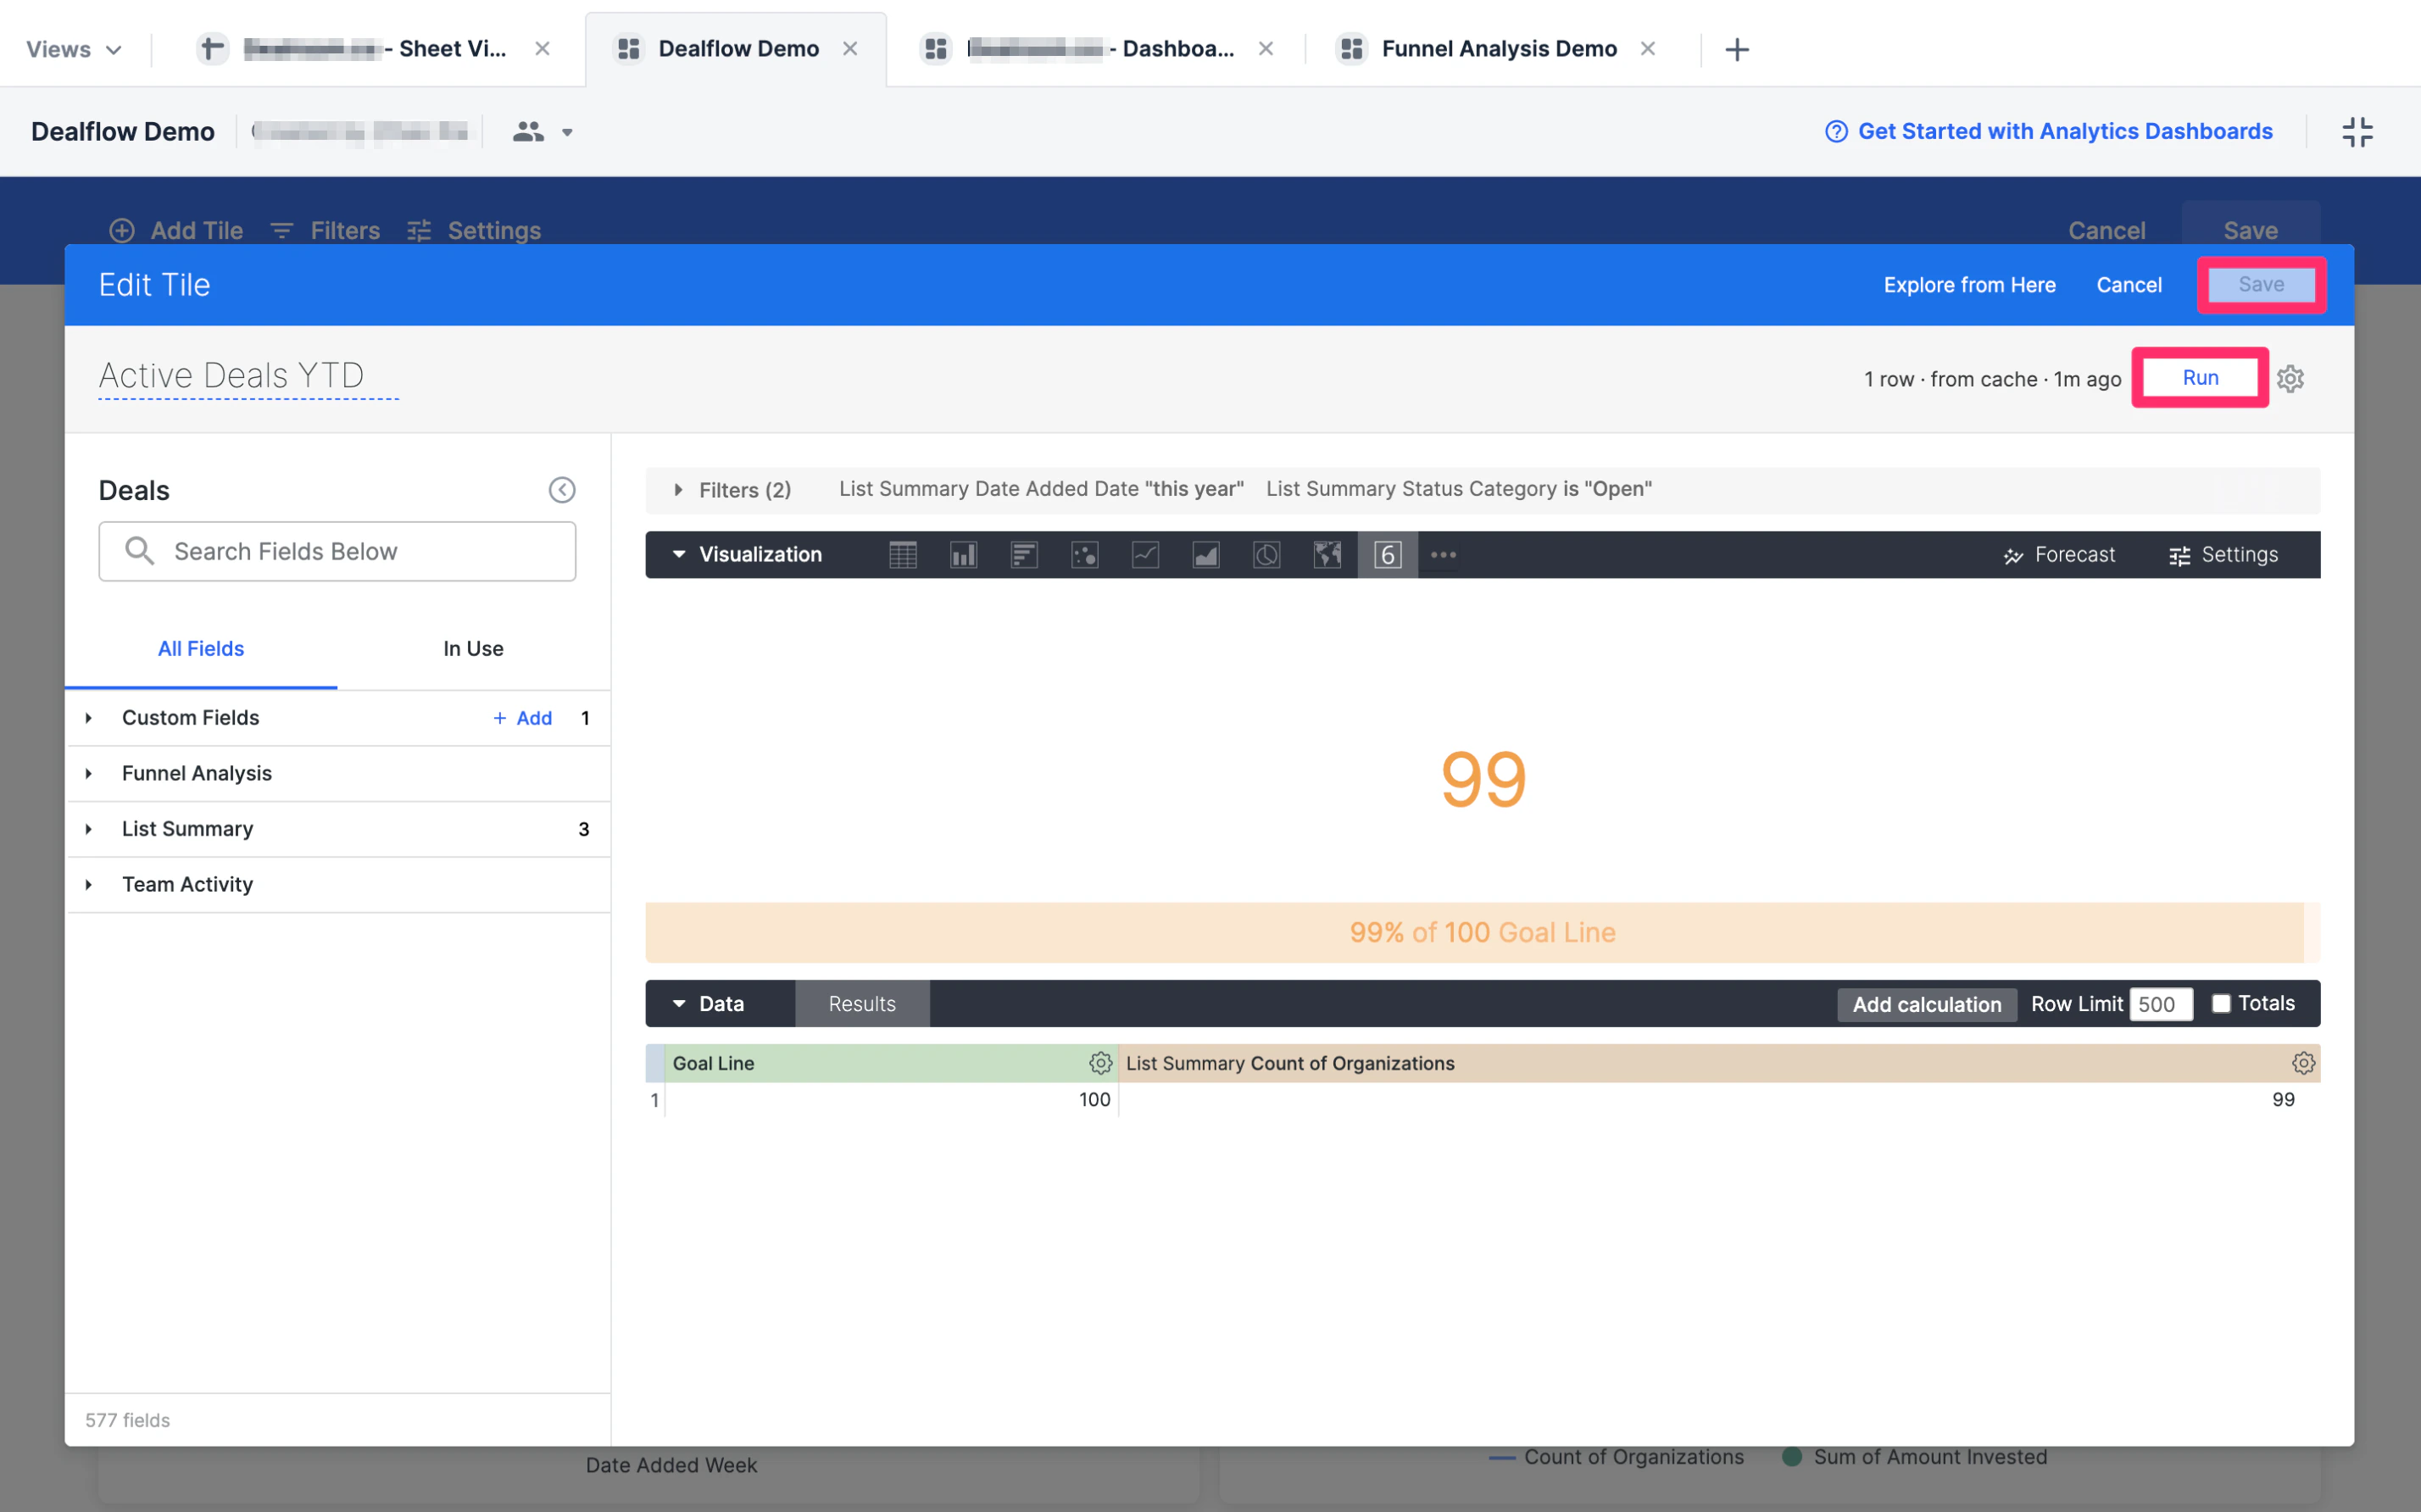 9. Click **Save** on the top-right corner to save the changes you made for the entire dashboard view and you're all set.