> ## Documentation Index
> Fetch the complete documentation index at: https://support.affinity.co/llms.txt
> Use this file to discover all available pages before exploring further.
# How To Export Dashboard Views
> Help center reference: How To Export Dashboard Views
**How-to** — task-oriented recipe.
Now that you've [created a dashboard view full of different data visualizations](/s/article/How-to-create-and-edit-tiles-in-dashboard-views), we'll be going over how to export them as PDFs or how to schedule them to be sent as automated emails to relevant colleagues and stakeholders.
**Note**: Only **Creators** are allowed to send reports to others, **Viewers** will only be able to send reports to themselves.
**Note**: This video contains the old navigation bar on the top, whereas the current navigation bar now lies on the left side of your screen. While the remaining content is still the same, rest assured that we will be updating our videos accordingly.
## How to export a dashboard view (one-time)
Once you've built out a dashboard, you can download it as a PDF or CSV and send it to others outside of your team Affinity account.
1. Click the **ellipsis (3-dotted icon)**, then click **Download**.
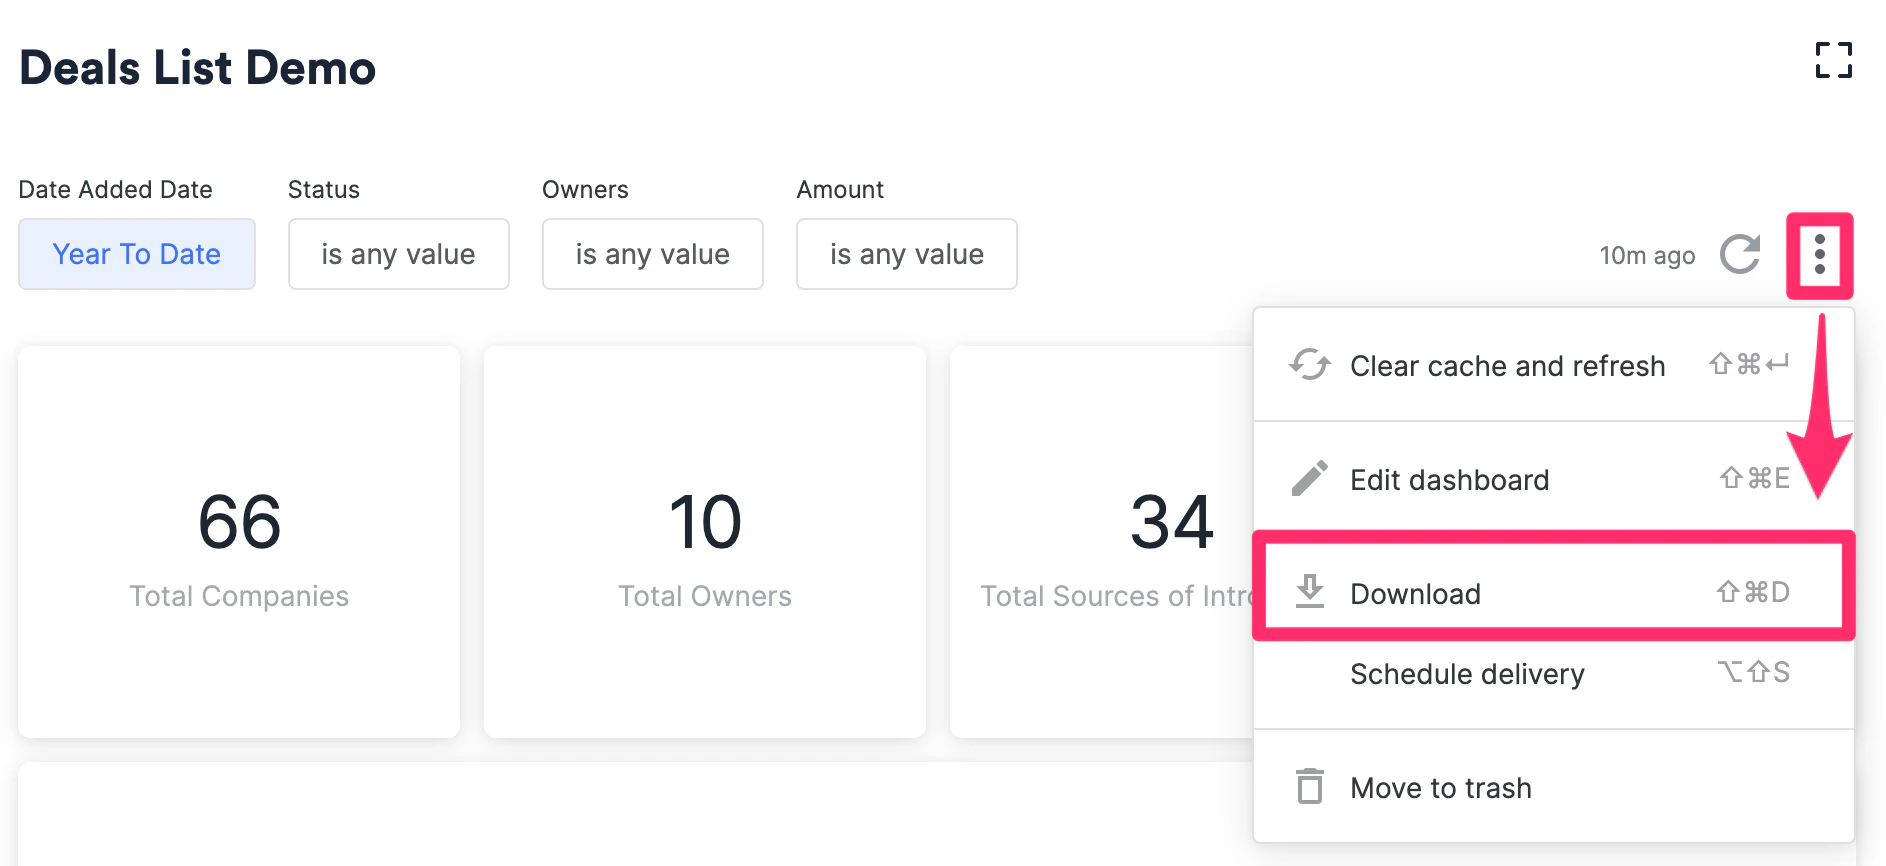 2. Select one of two formats: **PDF** or **CSV**.
1. The **PDF** format will display the visuals as is.
2. The **CSV** format will consist of multiple CSV files containing the quantitative values shown in each visualization tile.
2. Select one of two formats: **PDF** or **CSV**.
1. The **PDF** format will display the visuals as is.
2. The **CSV** format will consist of multiple CSV files containing the quantitative values shown in each visualization tile.
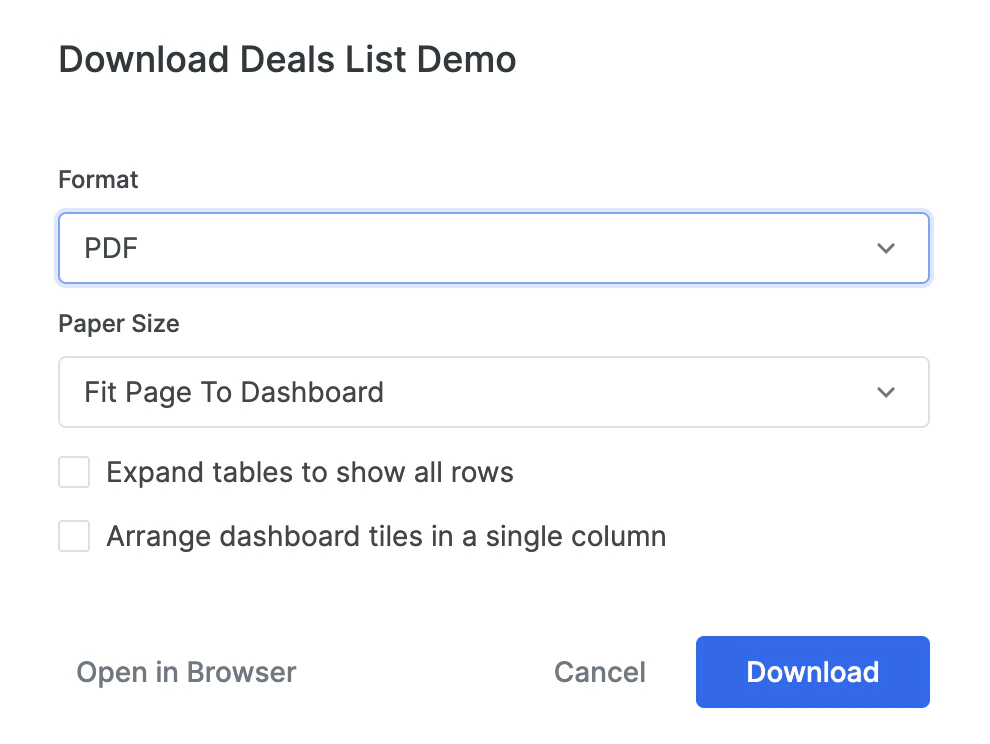 3. If you choose the PDF format, select a **Paper Size**. If you have a long dashboard with many tiles, we would highly suggest sticking with **Fit Page To Dashboard**.
1. You can additionally choose to expand tables to show all rows and not just a few.
2. You can additionally choose to arrange dashboard tiles in a single column.
3. You can click **Open in Browser** to see a preview of the PDF before choosing to download it.
4. Once you approve of the PDF, click **Download**.
4. If you choose the CSV format, simply click **Download**.
## How to email a dashboard view to yourself/others (one-time and recurring)
If you'd like to send out certain dashboards to yourself/others on a frequent basis, you can set it up so that you receive automated emails on a recurring basis.
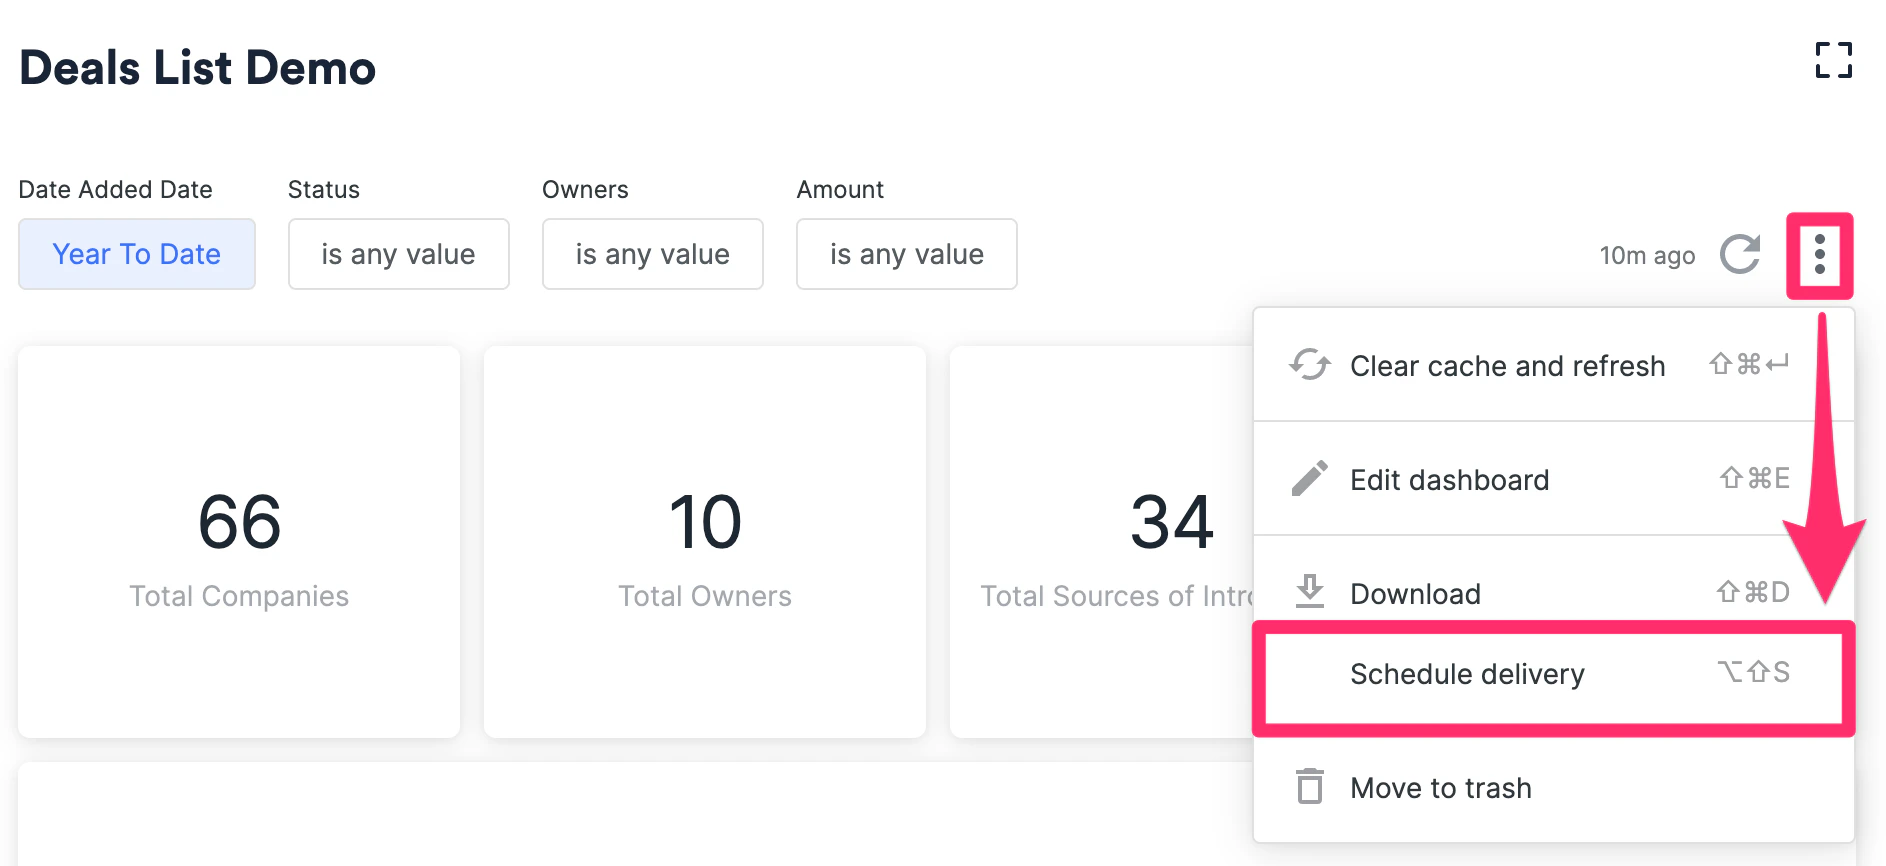
1. Click the **ellipsis (3-dotted icon)**, then click **Schedule delivery**.
3. If you choose the PDF format, select a **Paper Size**. If you have a long dashboard with many tiles, we would highly suggest sticking with **Fit Page To Dashboard**.
1. You can additionally choose to expand tables to show all rows and not just a few.
2. You can additionally choose to arrange dashboard tiles in a single column.
3. You can click **Open in Browser** to see a preview of the PDF before choosing to download it.
4. Once you approve of the PDF, click **Download**.
4. If you choose the CSV format, simply click **Download**.
## How to email a dashboard view to yourself/others (one-time and recurring)
If you'd like to send out certain dashboards to yourself/others on a frequent basis, you can set it up so that you receive automated emails on a recurring basis.
1. Click the **ellipsis (3-dotted icon)**, then click **Schedule delivery**.
 2. Select your preferred **Recurrence** and **Time**.
**Note**: The **Time** is only available in **Pacific Time (PT)** at the moment, so please adjust accordingly based on your timezone.
3\. Add all the email addresses you'd like to send this dashboard to.
2. Select your preferred **Recurrence** and **Time**.
**Note**: The **Time** is only available in **Pacific Time (PT)** at the moment, so please adjust accordingly based on your timezone.
3\. Add all the email addresses you'd like to send this dashboard to.
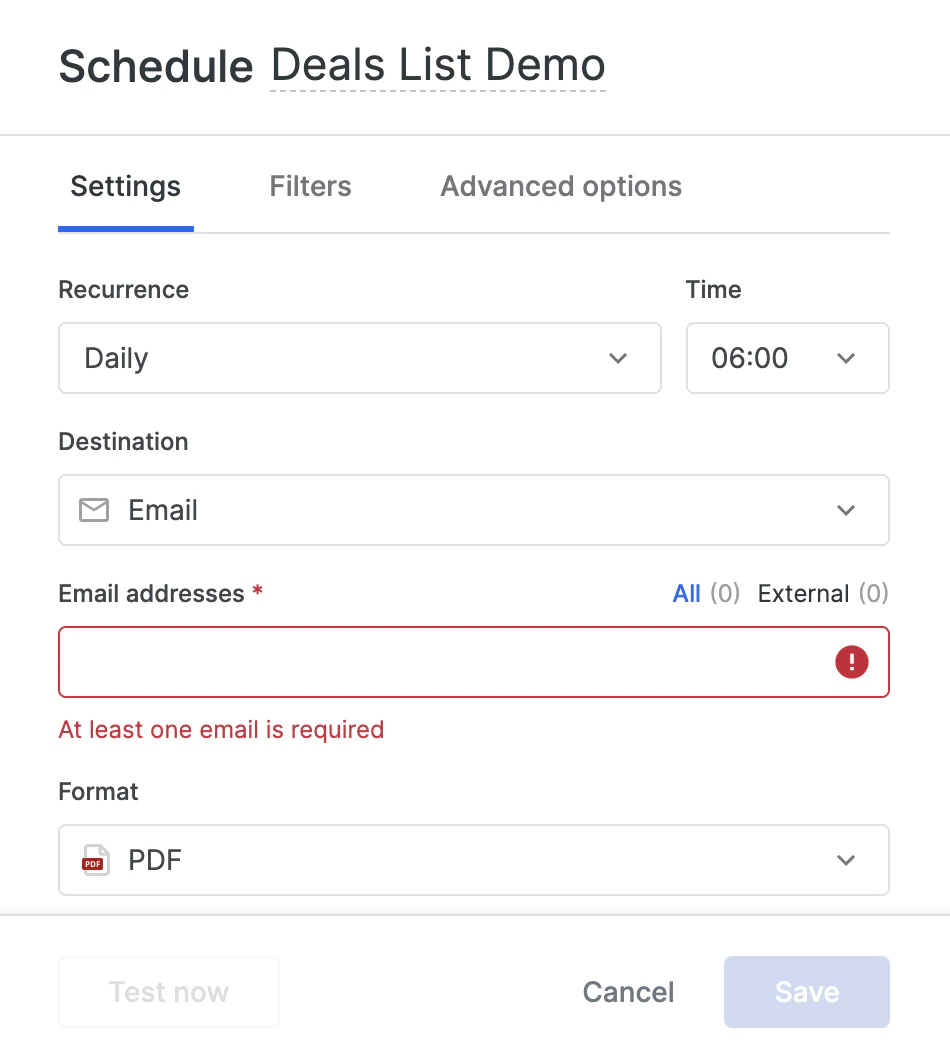 4. Select one of three formats: **PDF**, **PNG**, or **CSV**.
1. The **PDF** format will display the visuals as is.
2. The **PNG** format will display the visuals as is.
3. The **CSV** format will consist of multiple CSV files containing the quantitative values shown in each visualization tile.
5. Click **Save** and you're all set!
4. Select one of three formats: **PDF**, **PNG**, or **CSV**.
1. The **PDF** format will display the visuals as is.
2. The **PNG** format will display the visuals as is.
3. The **CSV** format will consist of multiple CSV files containing the quantitative values shown in each visualization tile.
5. Click **Save** and you're all set!