> ## Documentation Index
> Fetch the complete documentation index at: https://support.affinity.co/llms.txt
> Use this file to discover all available pages before exploring further.
# How To Create And Edit Tiles In Dashboard Views
> Help center reference
**How-to** — task-oriented recipe.
Now that you know [how to create a dashboard view](/s/article/How-to-create-a-dashboard-view) in your Affinity lists, we'll be going over **tiles**, the building blocks within a dashboard view that will help you visualize the data you'd like to see. You can build off of the pre-made dashboard templates (see [List Summary Reports](/s/article/Affinity-Analytics-List-Summary-Reports), [Team Activity Reports](/s/article/Affinity-Analytics-Team-Activity-Reports), and [Funnel Analysis Reports](/s/article/Affinity-Analytics-Funnel-Analysis-Reports)) or you can start from scratch. Regardless, there are two types of tiles you can create within a dashboard view - **text tiles** and **visualization tiles**.
**Note**: This video contains the old navigation bar on the top, whereas the current navigation bar now lies on the left side of your screen. While the remaining content is still the same, rest assured that we will be updating our videos accordingly. Within visualization tiles, you will come across two important terms, **dimensions** and **measures**.
* **Dimensions** - The fields containing the data points that will be used in the visualization.
* **Measures** - The method used to quantify the data points that will be used in the visualization. Feel free to follow these step-by-step instructions below:
1. Click into the list that contains the dashboard view you'd like to create and edit tiles within.
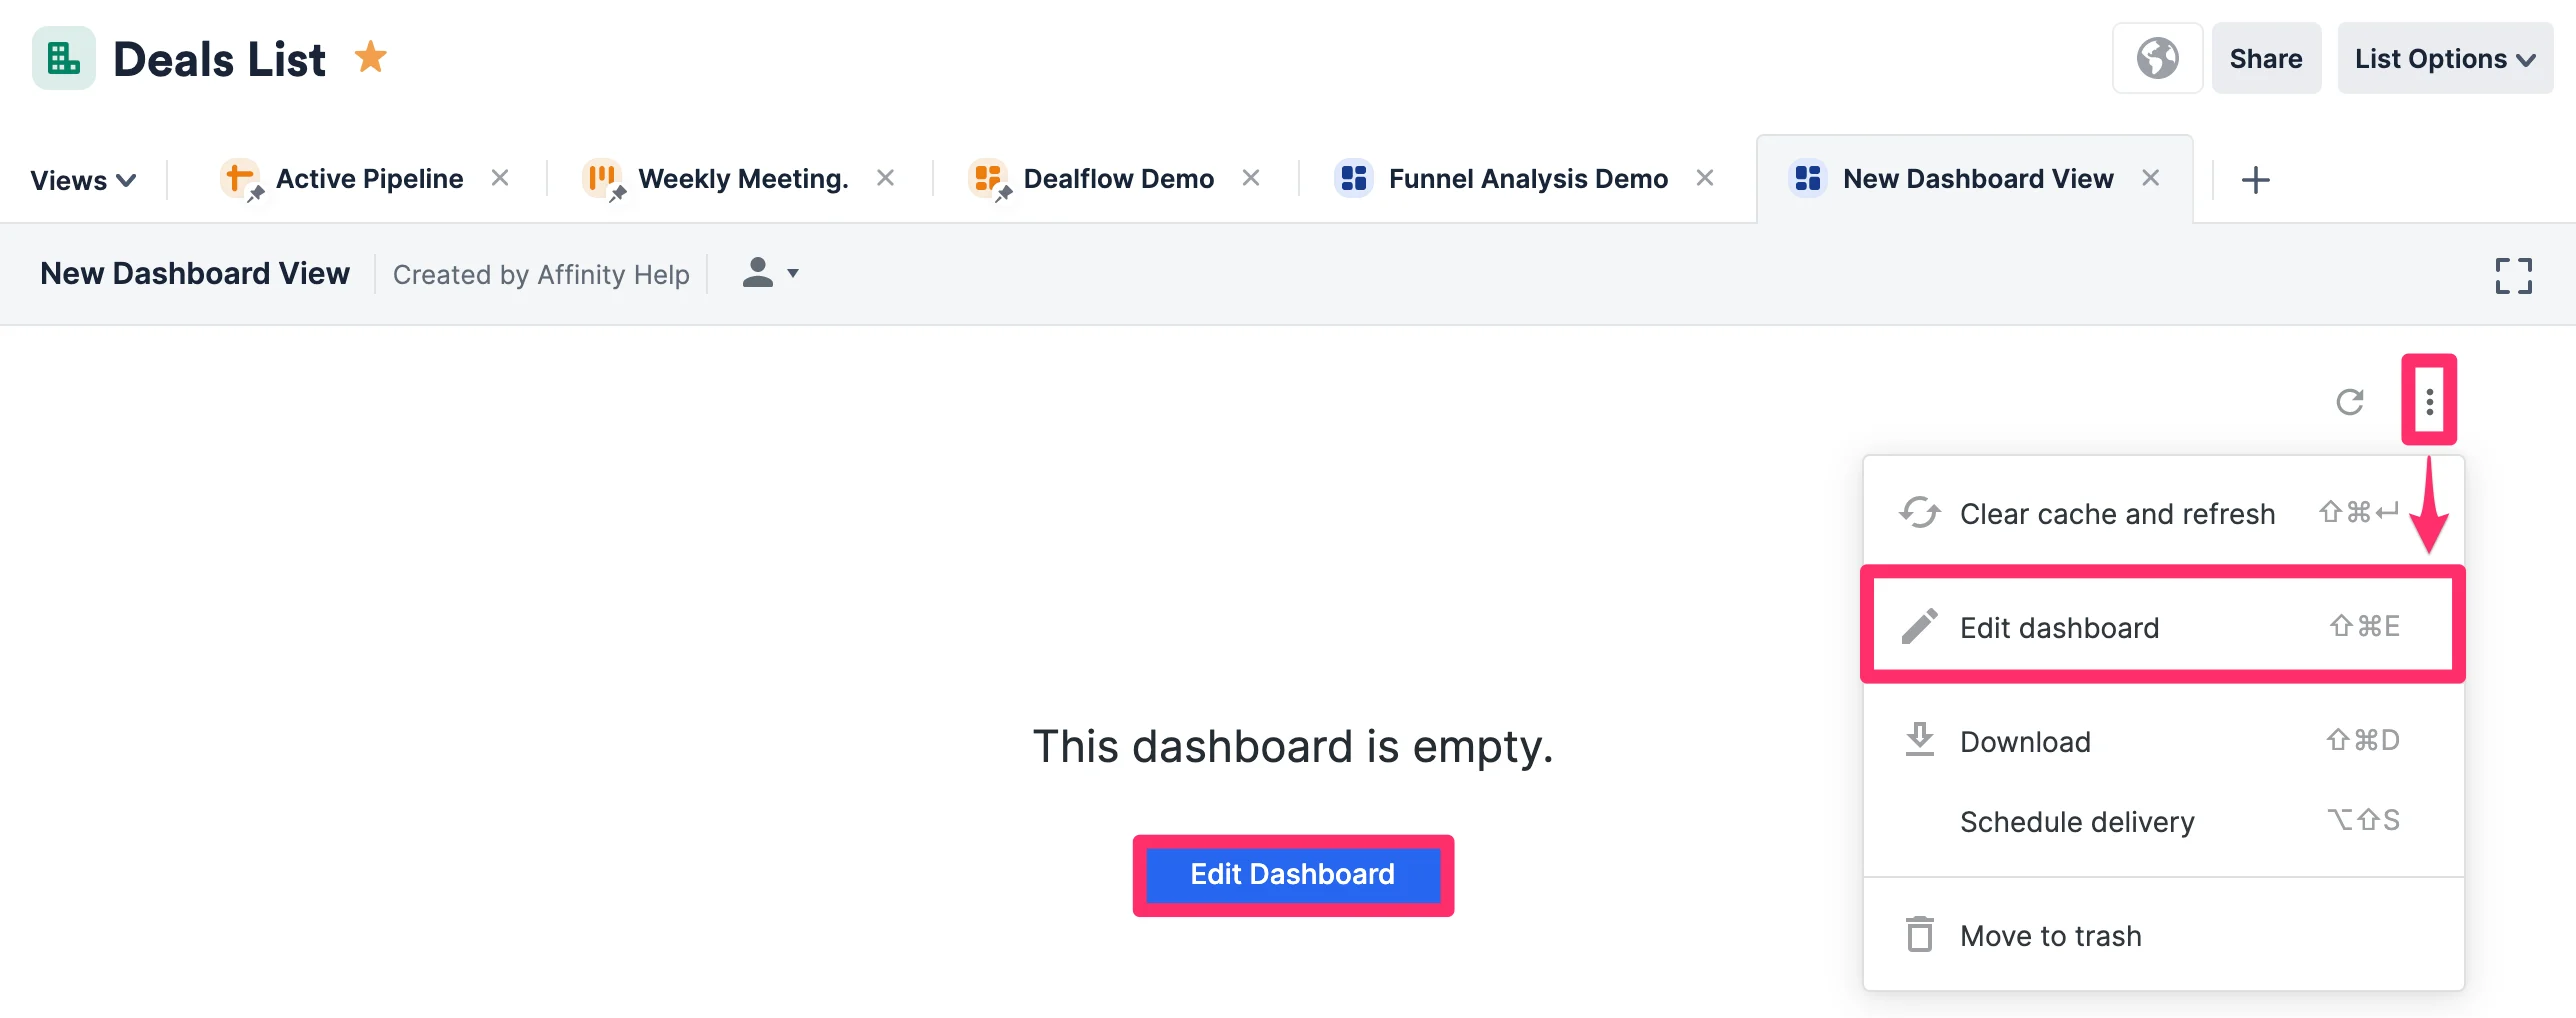
2. Click **Edit Dashboard**. You can also click the **ellipsis (3-dotted icon)** to edit the dashboard in the future.
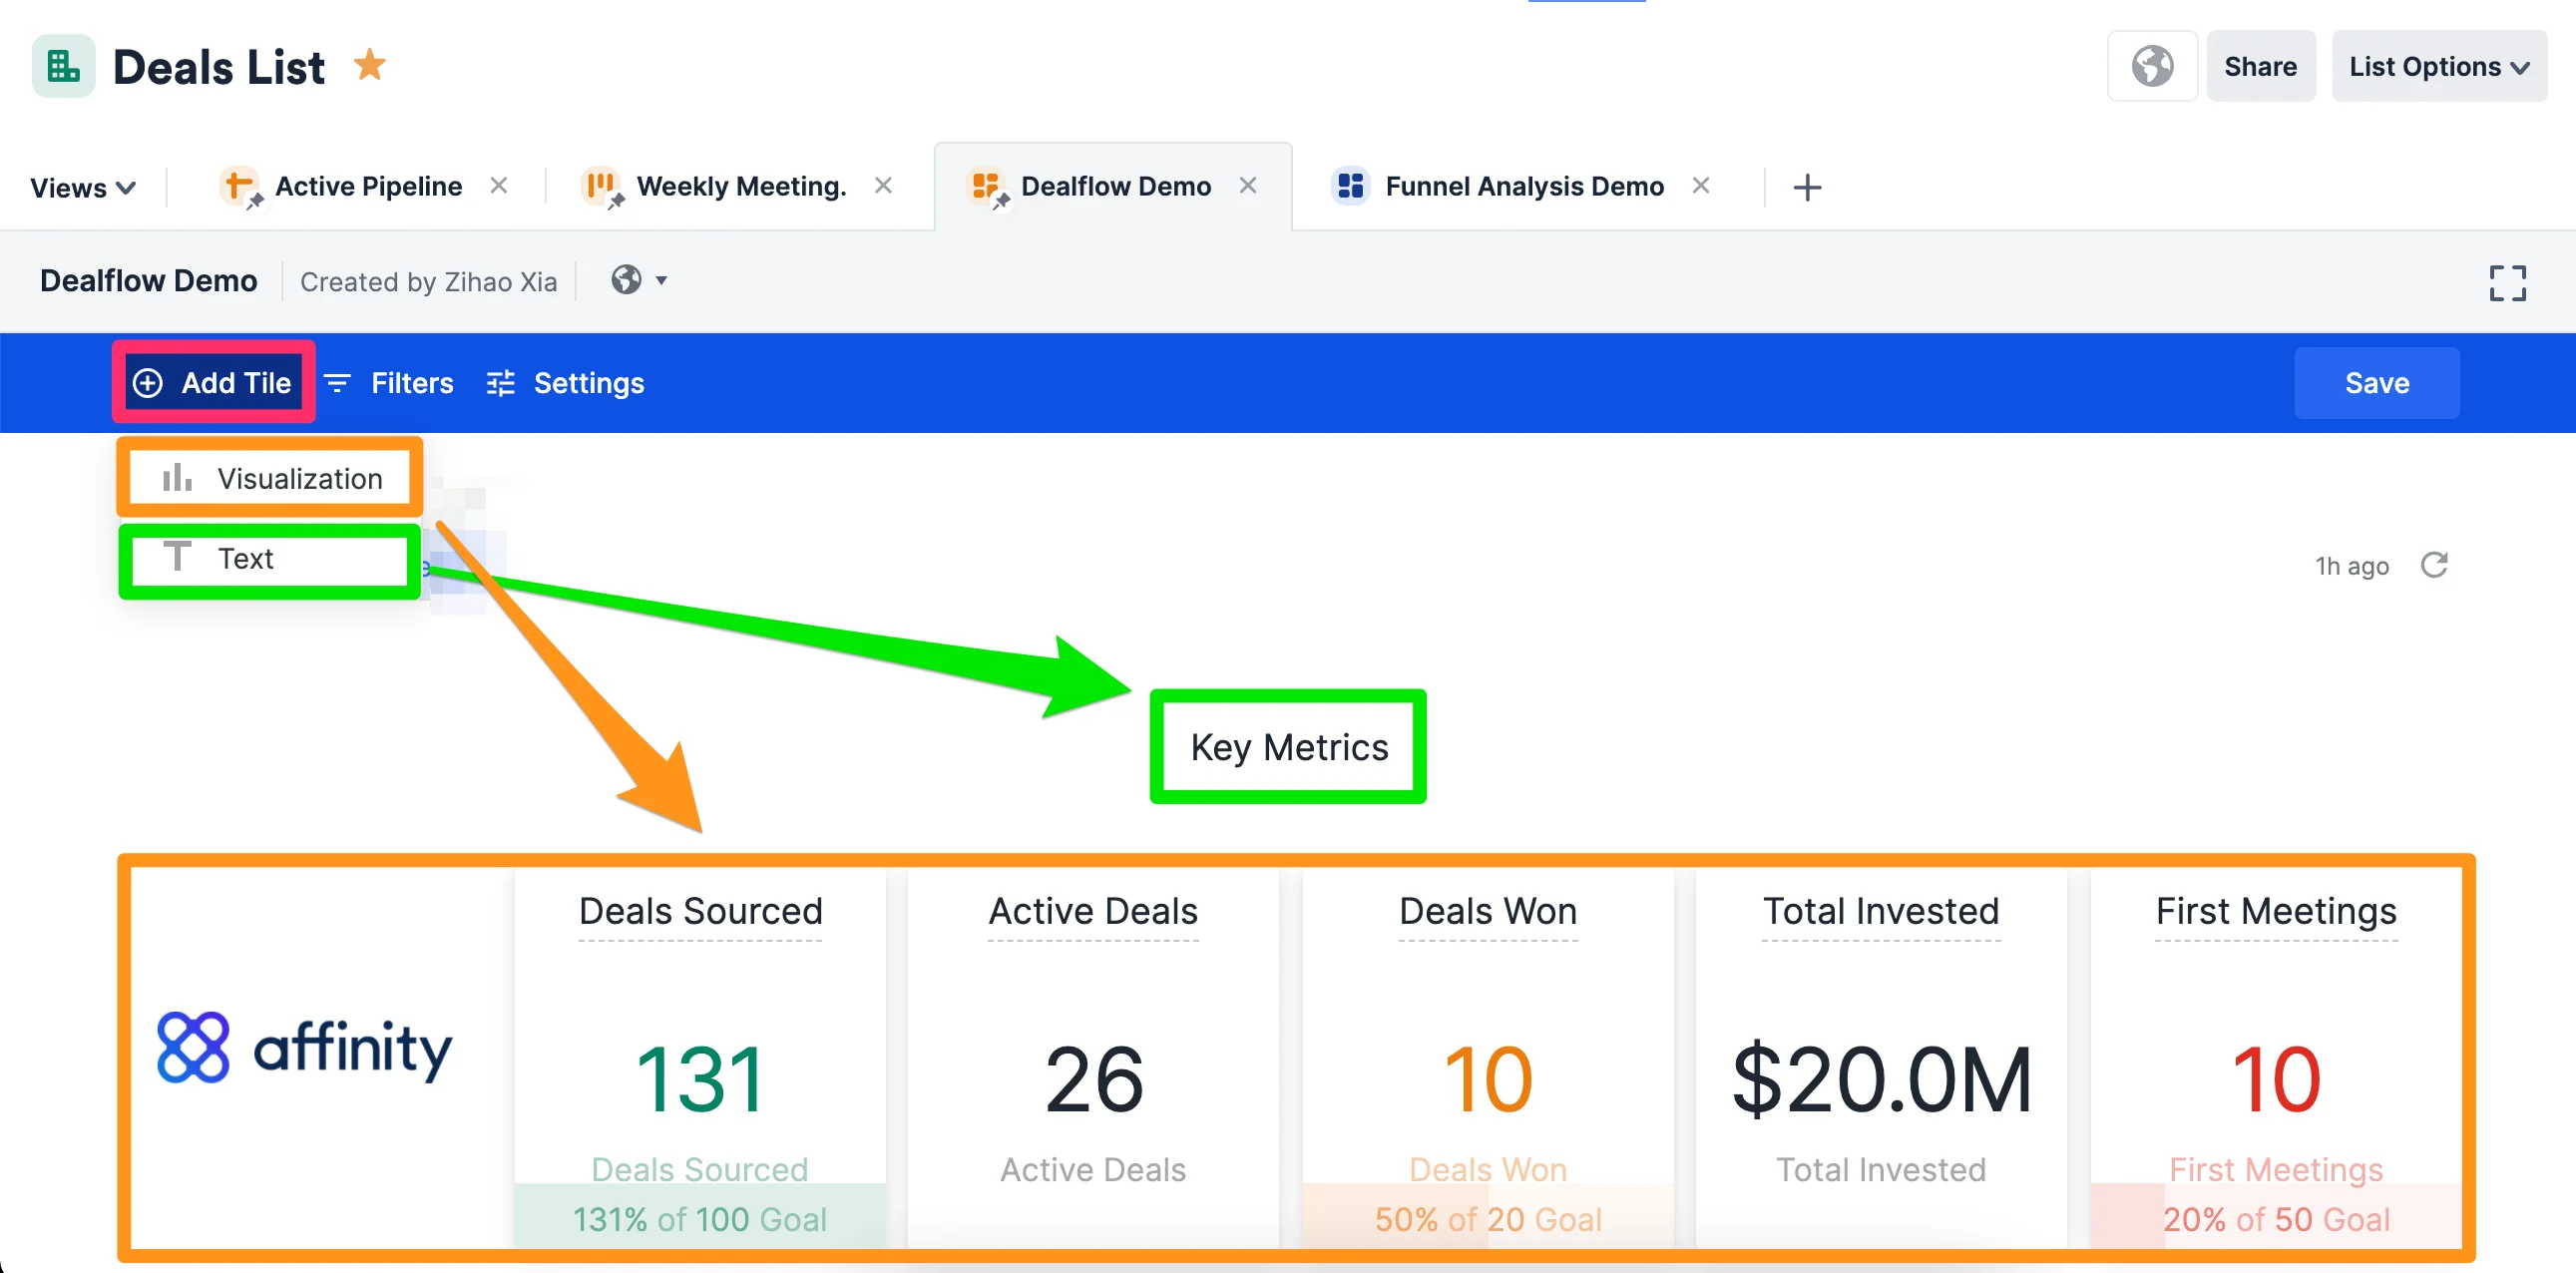
 3. Now, click **Add Tile**. You can choose from two types of tiles: **Visualization** or **Text**.
1. **Visualization tiles** display quantities and metrics.
2. **Text tiles** only allow text and serve as headers for different sections of your dashboard.
3. Now, click **Add Tile**. You can choose from two types of tiles: **Visualization** or **Text**.
1. **Visualization tiles** display quantities and metrics.
2. **Text tiles** only allow text and serve as headers for different sections of your dashboard.
 4. Given that visualization tiles will be used most frequently, click **Visualization**.
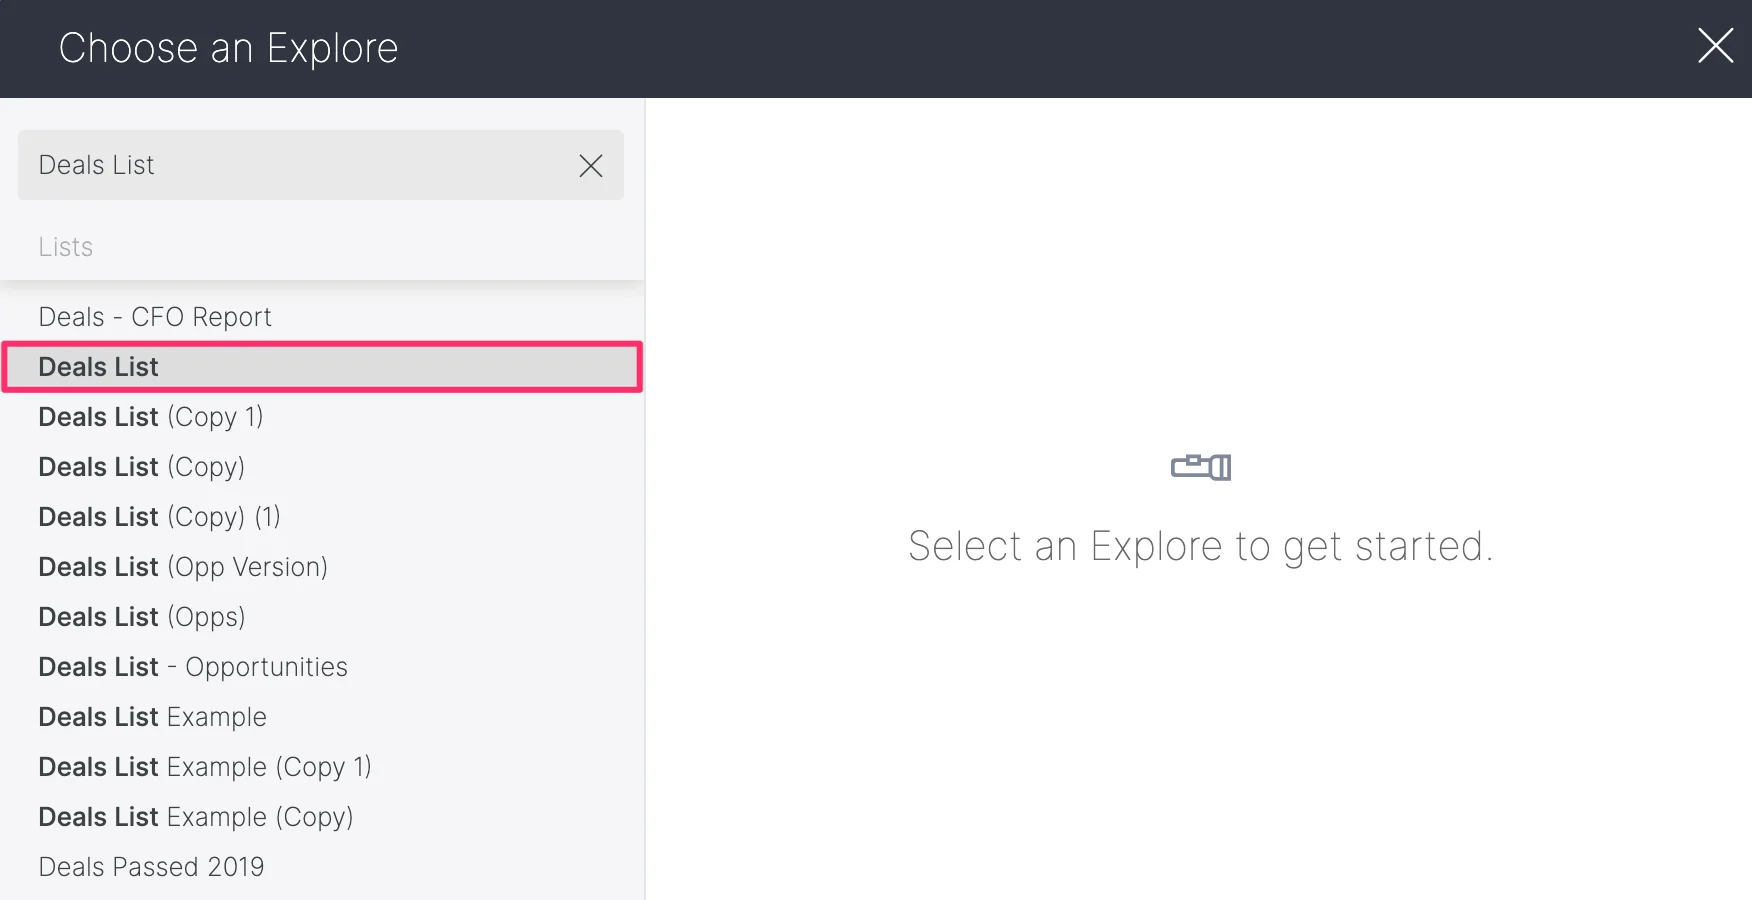
5. Select the list you want to generate a visualization for. In this example, we will choose the **Deals List**.
4. Given that visualization tiles will be used most frequently, click **Visualization**.
5. Select the list you want to generate a visualization for. In this example, we will choose the **Deals List**.
 6. Given that this is a multi-step process, we've broken it down for you.
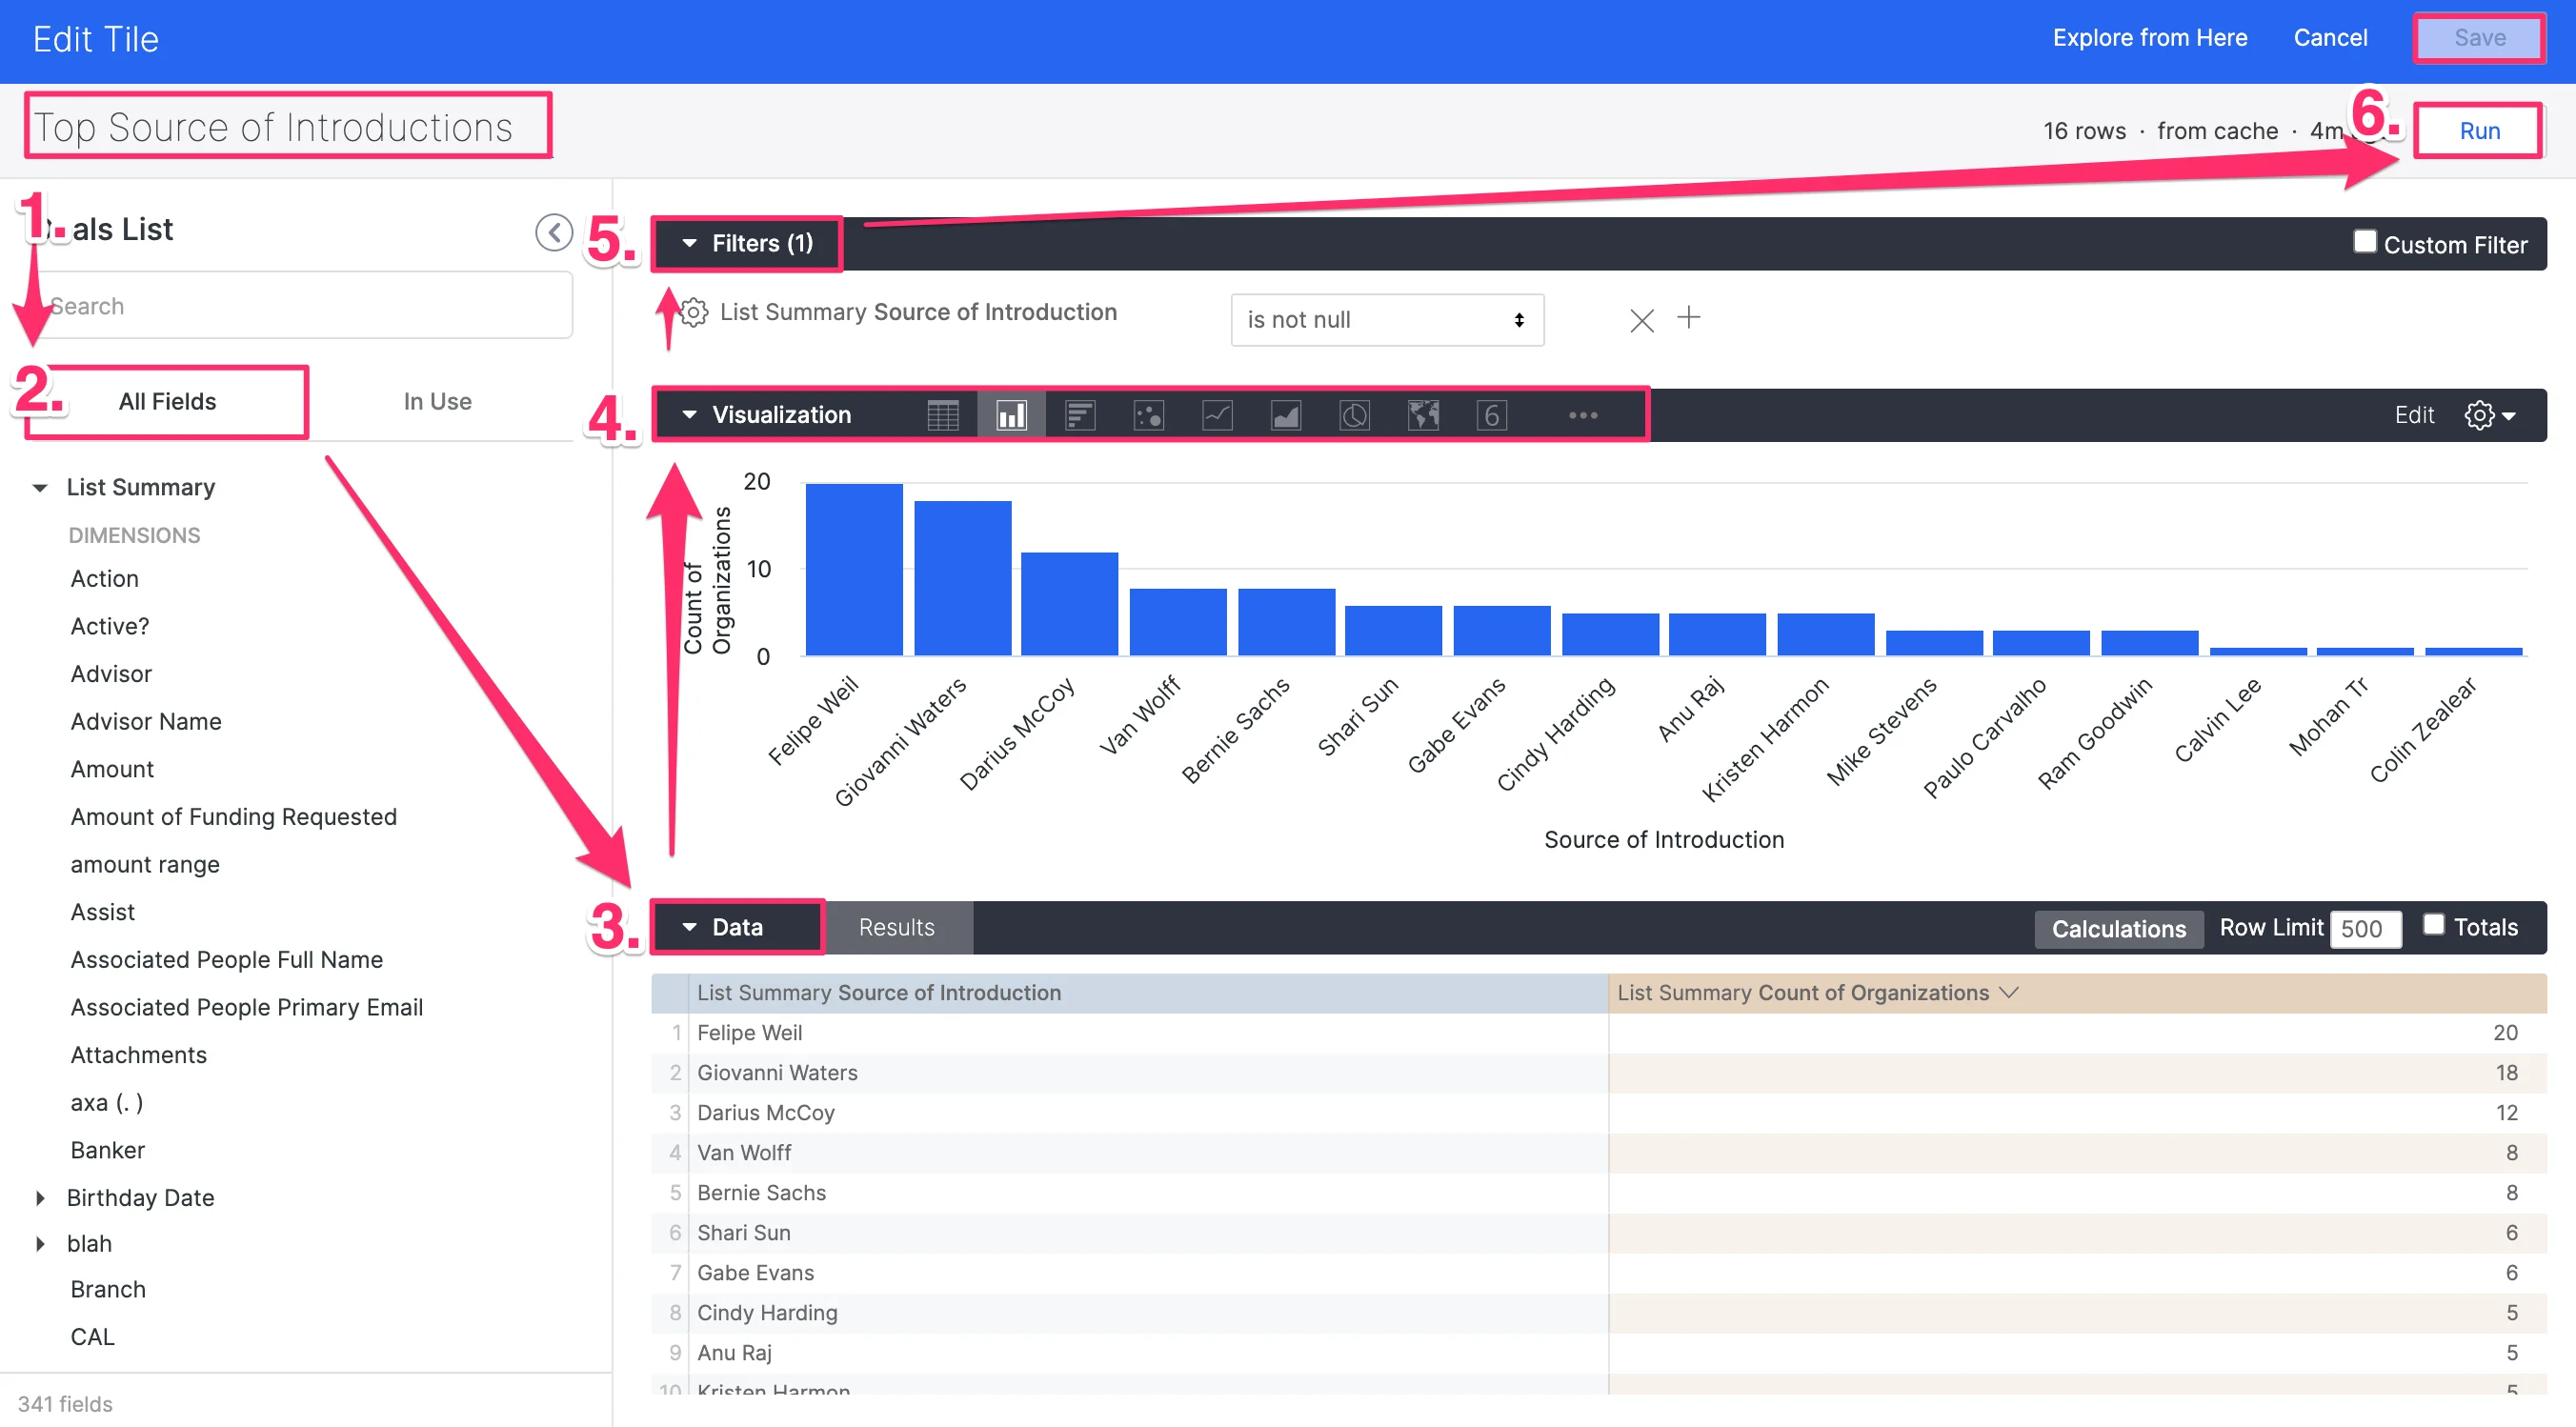 1. First, name this visualization tile. In this example, we'll name it "Top Source of Introductions."
2. Then, click the **All Fields** tab and select the **dimensions** (the fields) and **measures** (the unit of measurement) that will make up the visualization.
3. You'll see the relevant data appear in the **Data** section. Click **Run** to see updates whenever you change your dimensions or measures.
4. Now, click any visualization option to display the chosen dimensions and measures. You can choose from table charts, vertical column graphs, horizontal bar graphs, scatterplots, line graphs, area graphs, pie charts, maps, and single values.
5. You can also apply filters to focus on specific field values. Click **Run** to see updates whenever you change your filters.
6. Finally, click **Run** one more time after everything is set, then click **Save**.
7. Now, you should see your newly-created visualization tile showing the relevant data.
1. First, name this visualization tile. In this example, we'll name it "Top Source of Introductions."
2. Then, click the **All Fields** tab and select the **dimensions** (the fields) and **measures** (the unit of measurement) that will make up the visualization.
3. You'll see the relevant data appear in the **Data** section. Click **Run** to see updates whenever you change your dimensions or measures.
4. Now, click any visualization option to display the chosen dimensions and measures. You can choose from table charts, vertical column graphs, horizontal bar graphs, scatterplots, line graphs, area graphs, pie charts, maps, and single values.
5. You can also apply filters to focus on specific field values. Click **Run** to see updates whenever you change your filters.
6. Finally, click **Run** one more time after everything is set, then click **Save**.
7. Now, you should see your newly-created visualization tile showing the relevant data.
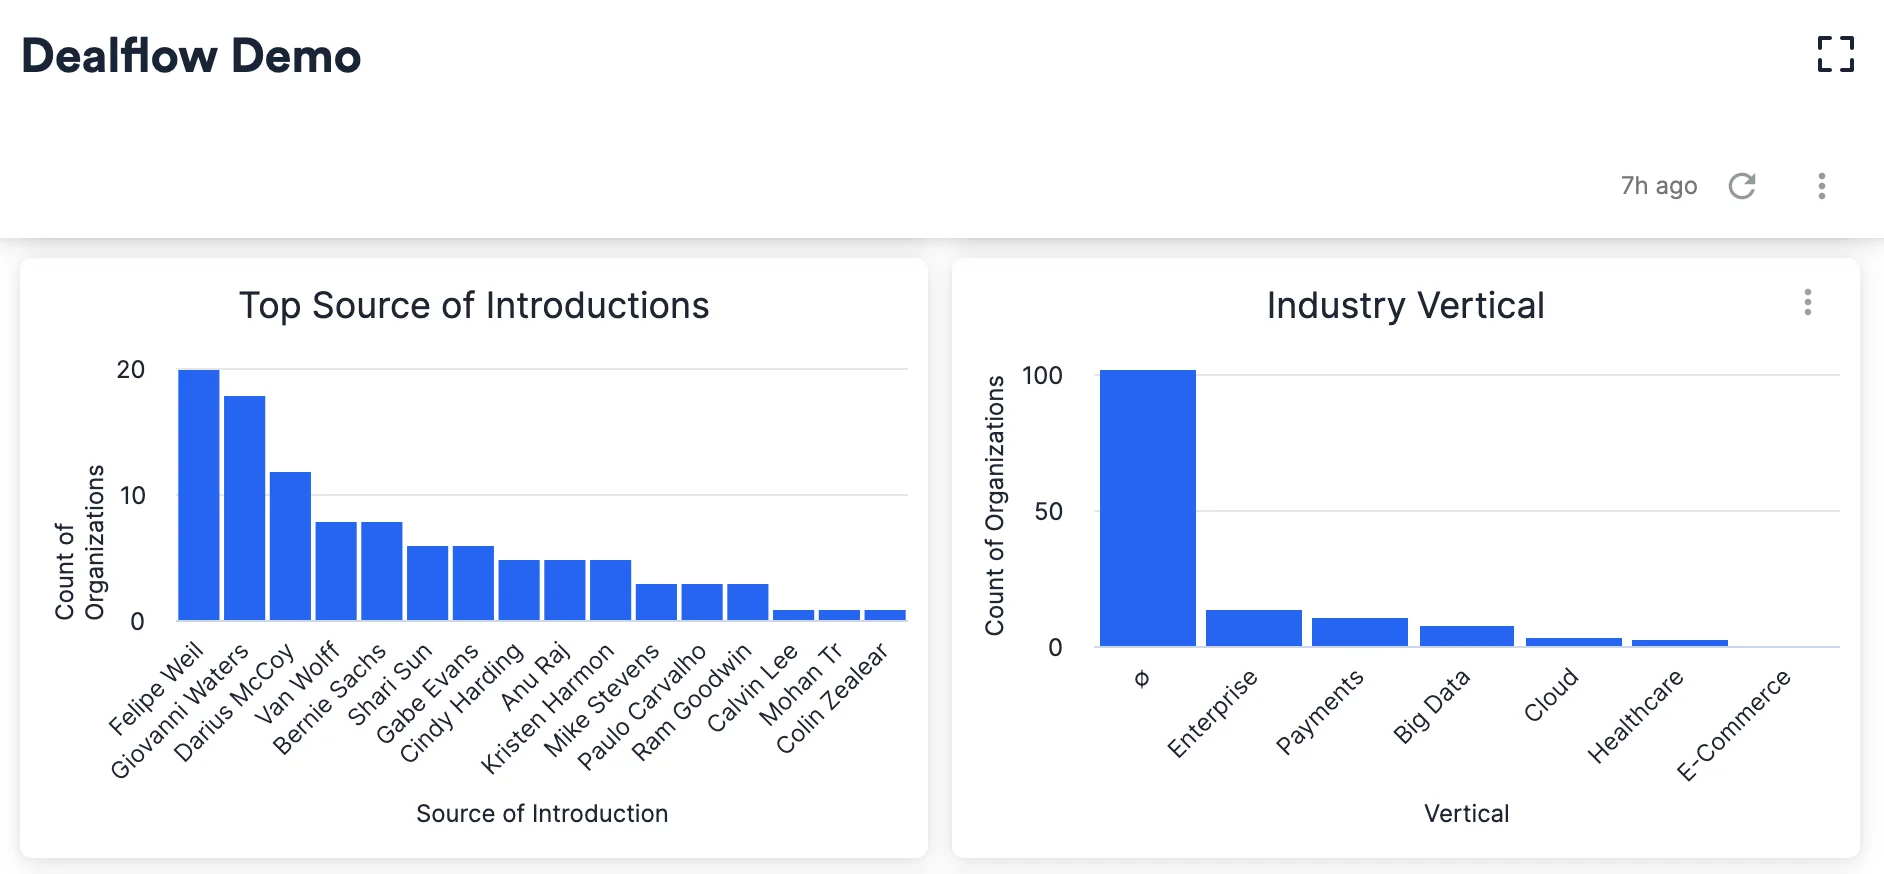 8. Repeat the steps above based on the different metrics you'd like to track, and you'll have a dashboard that consists of multiple visualizations to help you/your team understand overall team performance and workflow efficiency.
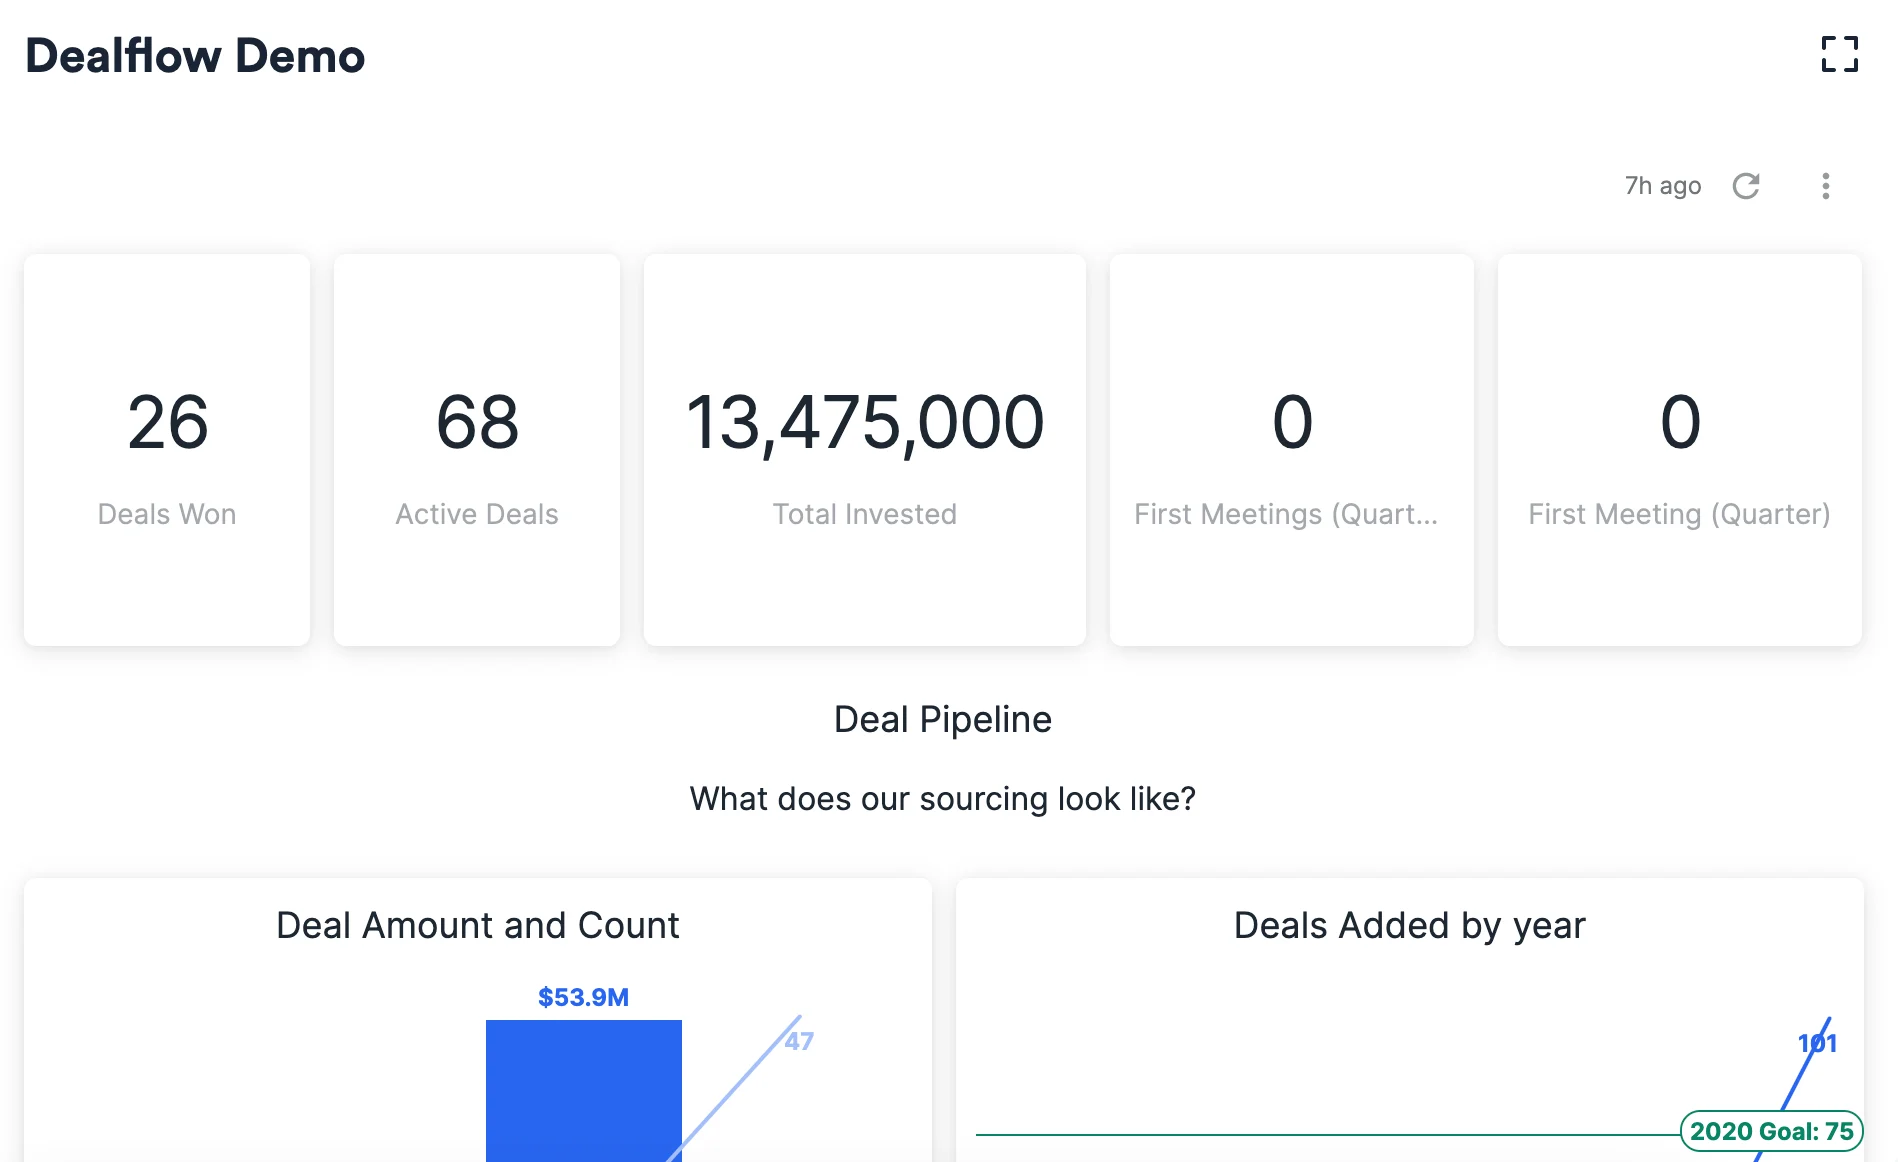 9. Feel free to copy your dashboard URL and share it with fellow members on your team Affinity account.
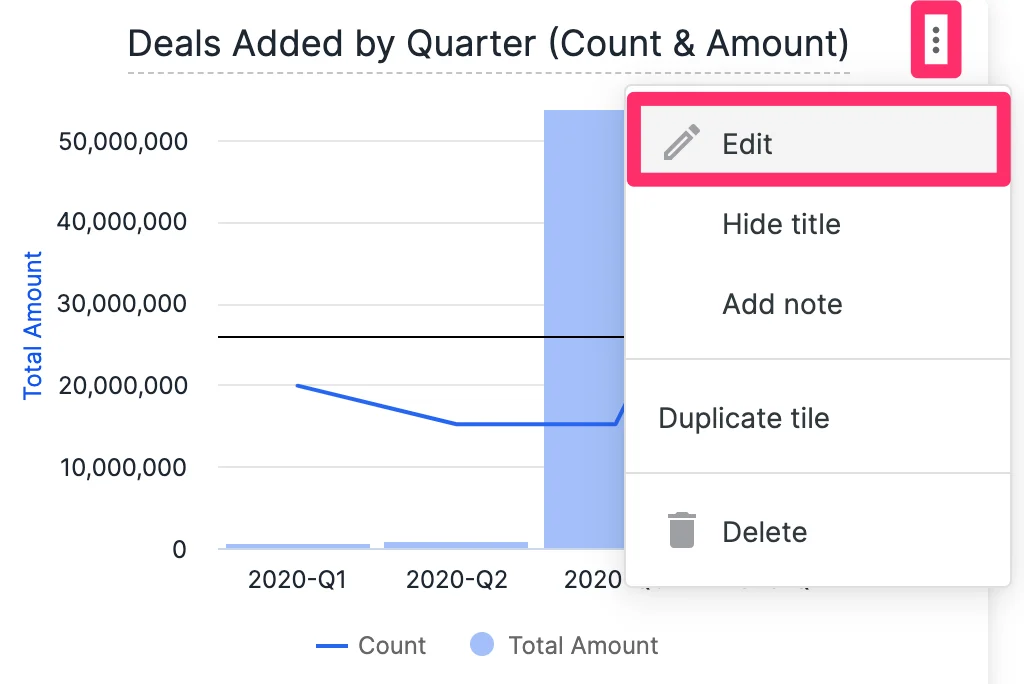
10. If you need to edit any tiles after they've been created, simply go back to **Edit** mode for the entire dashboard (see Step 2), then click the ellipsis (3-dotted icon) within the tile to make the necessary changes.
9. Feel free to copy your dashboard URL and share it with fellow members on your team Affinity account.
10. If you need to edit any tiles after they've been created, simply go back to **Edit** mode for the entire dashboard (see Step 2), then click the ellipsis (3-dotted icon) within the tile to make the necessary changes.
 Once you're done, feel free to check out how you can [apply filters to these dashboard views](/s/article/How-to-apply-filters-in-dashboard-views). Otherwise, you can check out how to [export these dashboard views](/s/article/How-to-export-dashboard-views) as downloadable PDFs or how to schedule them to be sent as automated emails to relevant colleagues and stakeholders.