> ## Documentation Index
> Fetch the complete documentation index at: https://support.affinity.co/llms.txt
> Use this file to discover all available pages before exploring further.
# How To Apply Filters In Dashboard Views
> Help center reference
**How-to** — task-oriented recipe.
Now that you've [created a dashboard view](/s/article/How-to-create-a-dashboard-view) full of different data visualizations, you can apply filters to all tiles based on fields like **Status** or **Owners**, conduct cross-filters based on specific data points, or apply filters to specific tiles.
## Overview
* These filters apply to all tiles and will always be available under the dashboard view's title.
* On the other hand, cross-filters are temporarily applied and will clear upon refreshing your dashboard view.
* Set up filters that you'd like to apply to specific tiles, not all tiles.
**Note**: This video contains the old navigation bar on the top, whereas the current navigation bar is now on the left side of your screen. While the remaining content is still the same, rest assured that we will be updating our videos accordingly.
## How to set up filters on your dashboard views
Set up filters based on certain fields like **Status**, **Owners**, and more. These filters apply to all tiles and will always be available under the dashboard's title.
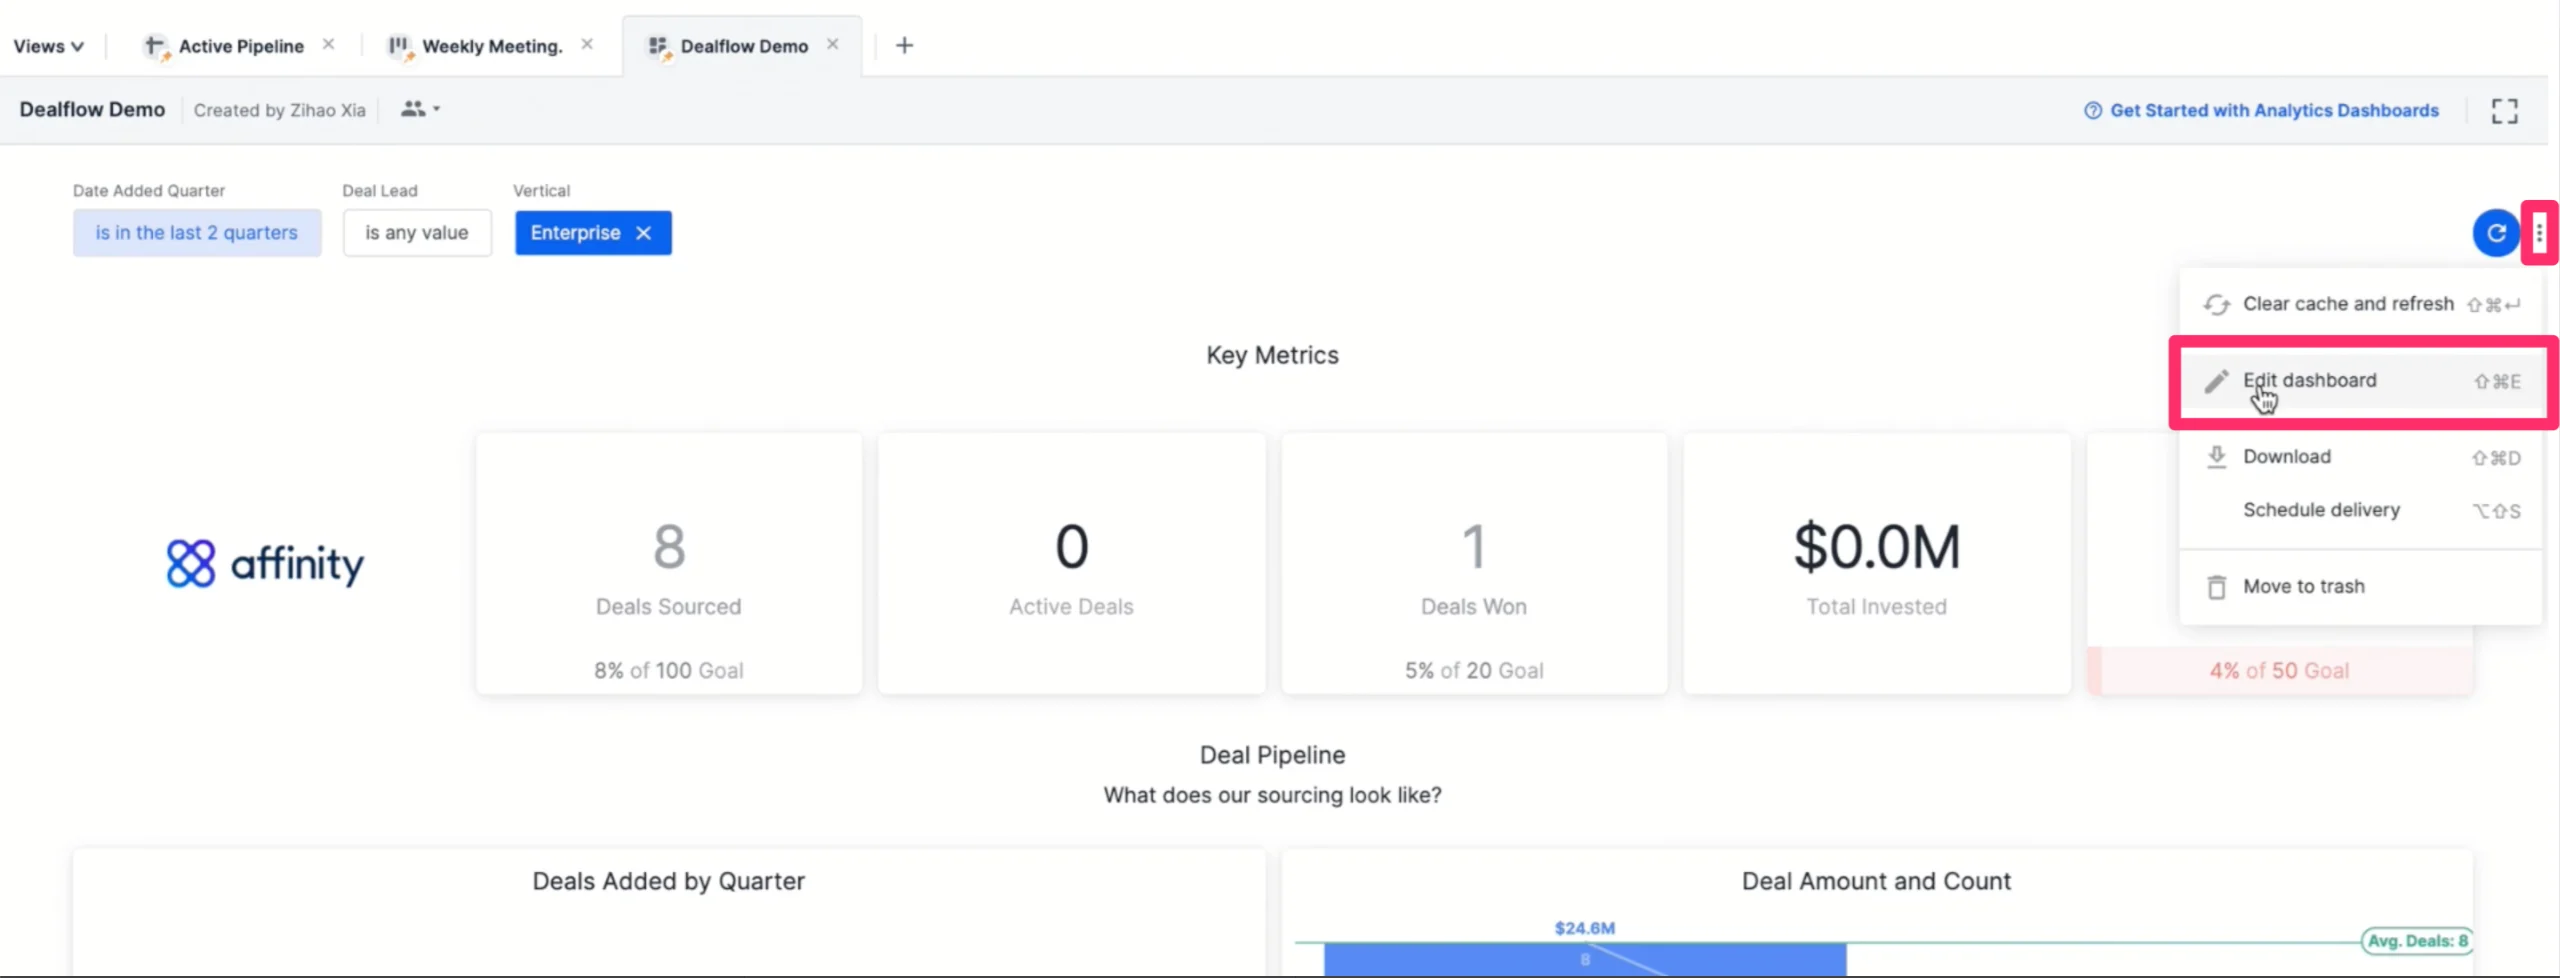
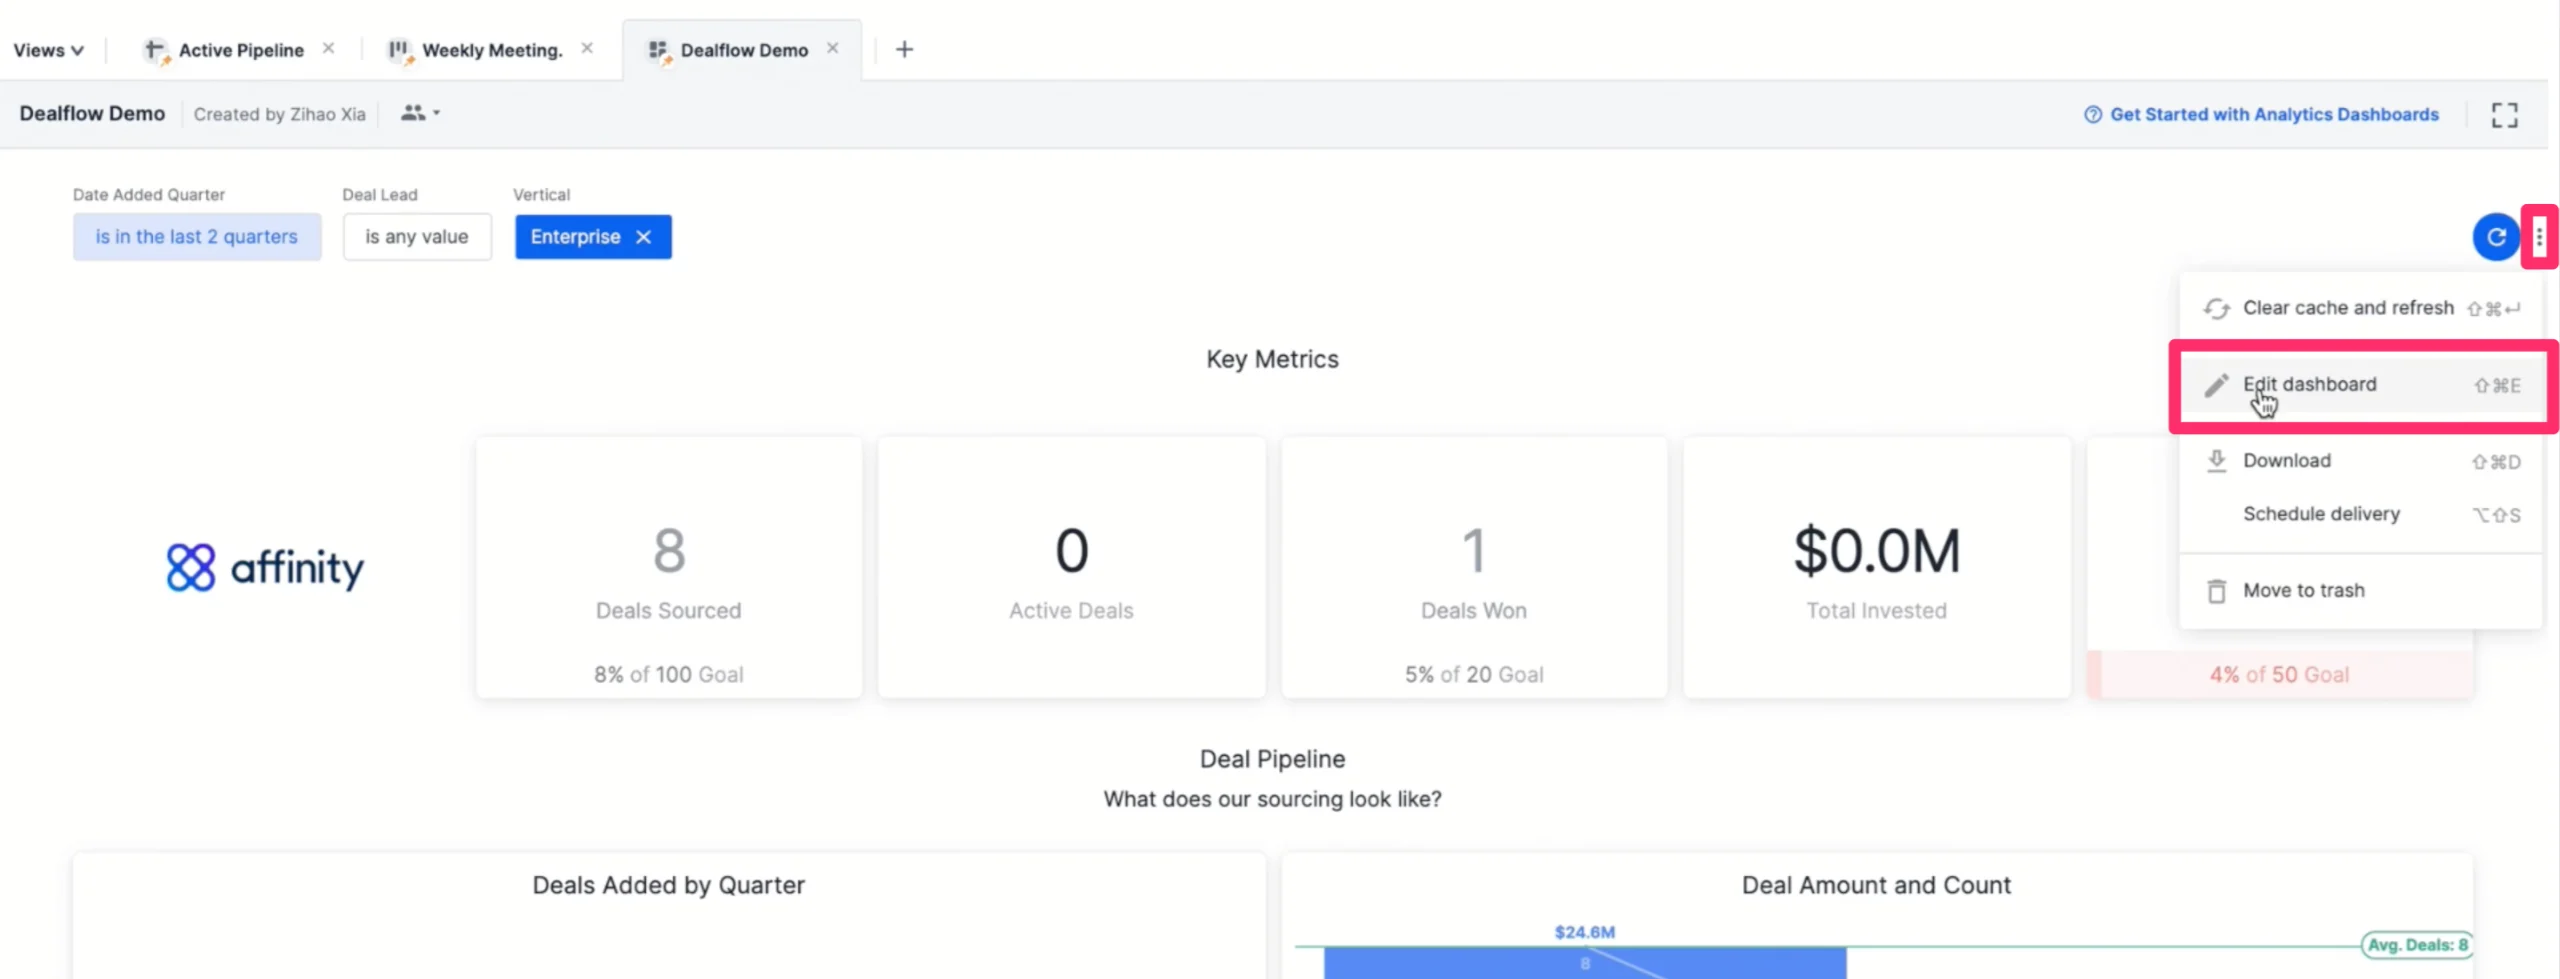
1. To set up a filter, click the **ellipsis (3-dotted icon)** in the dashboard, then click **Edit dashboard**.
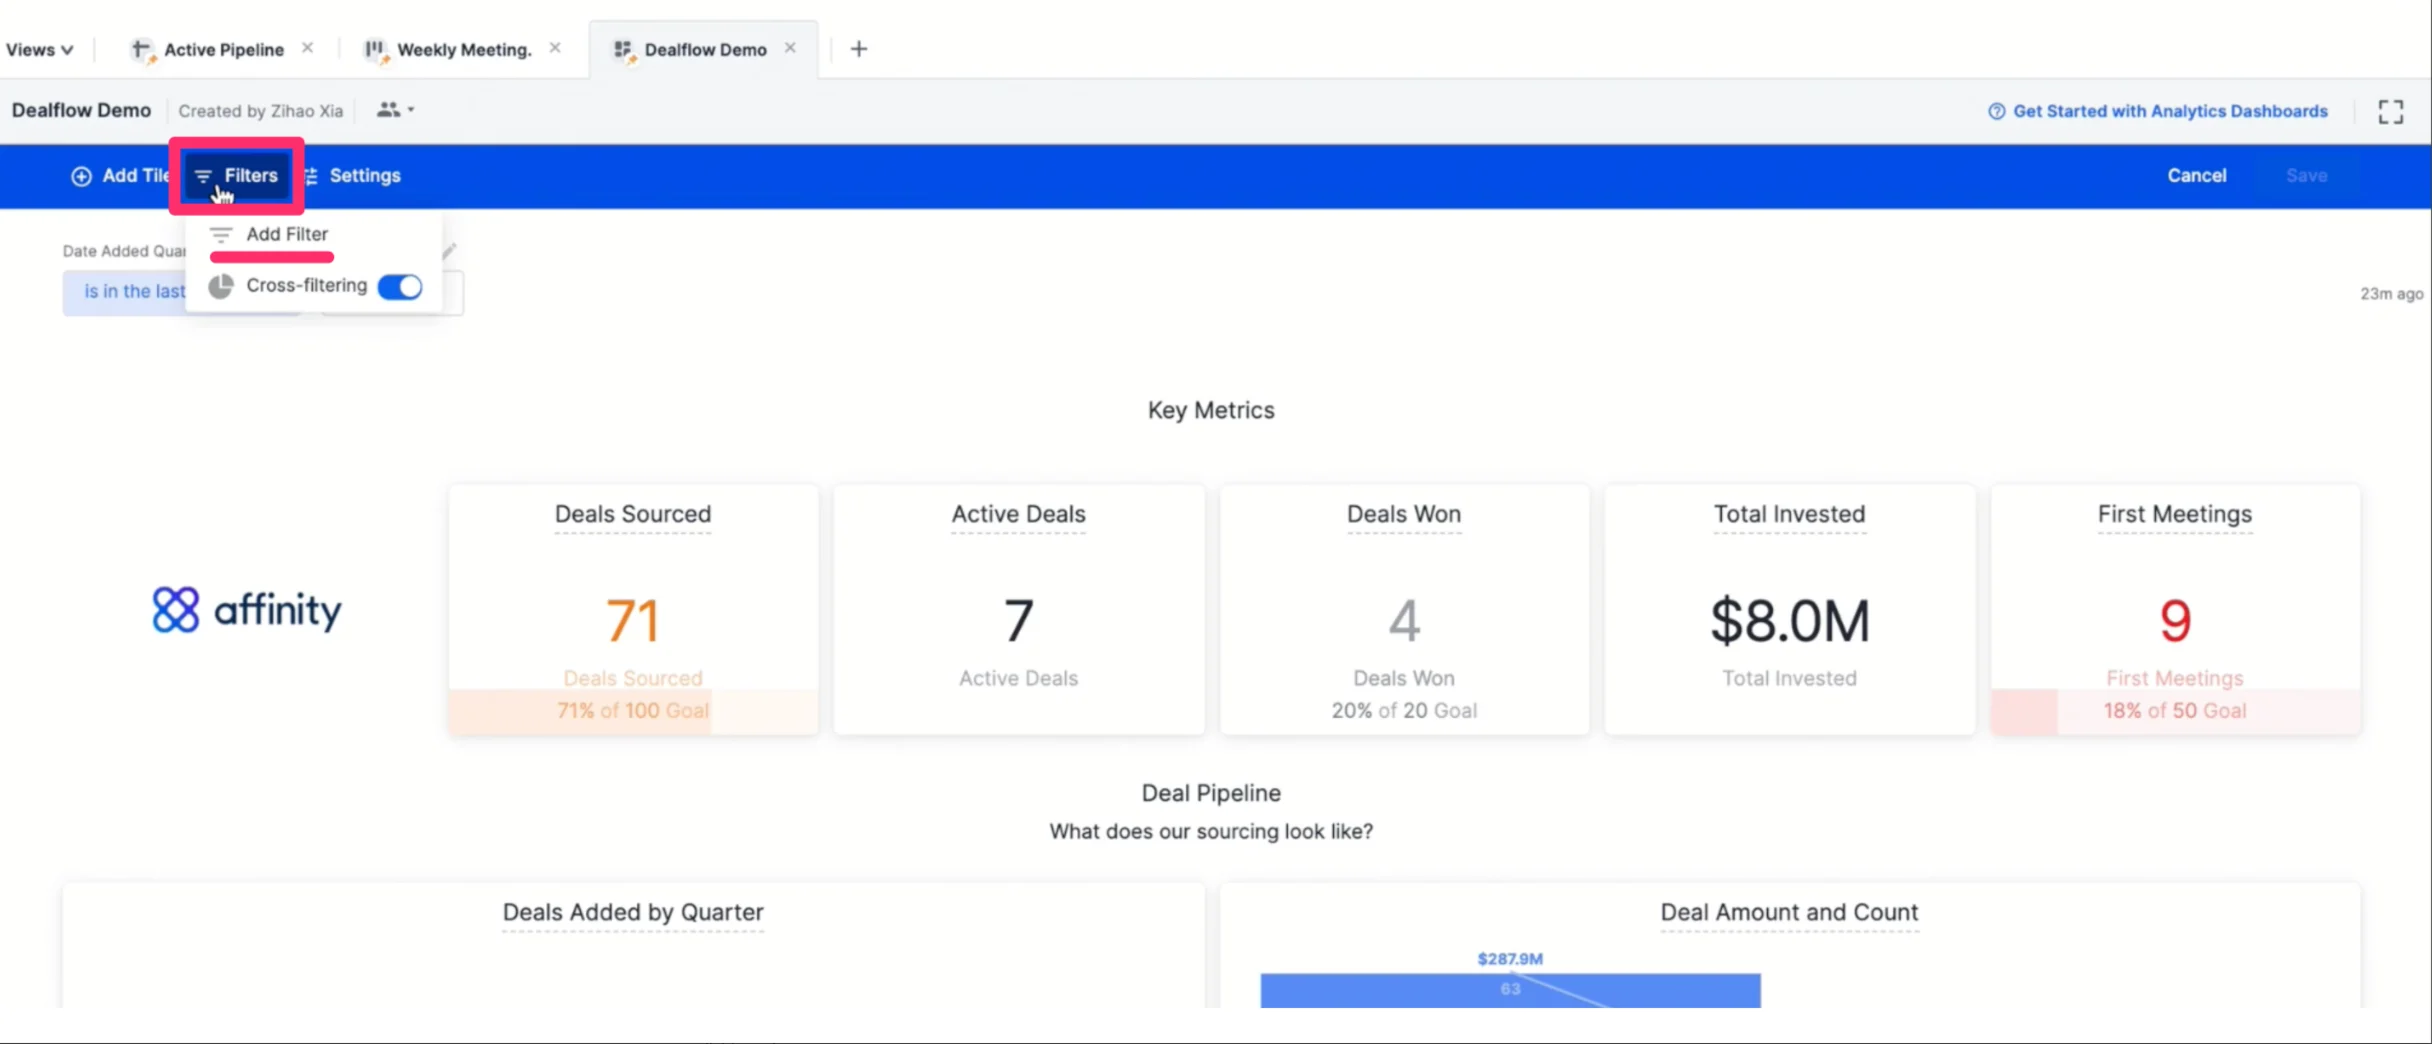
 2. Click **Filters**, then click **Add Filter**.
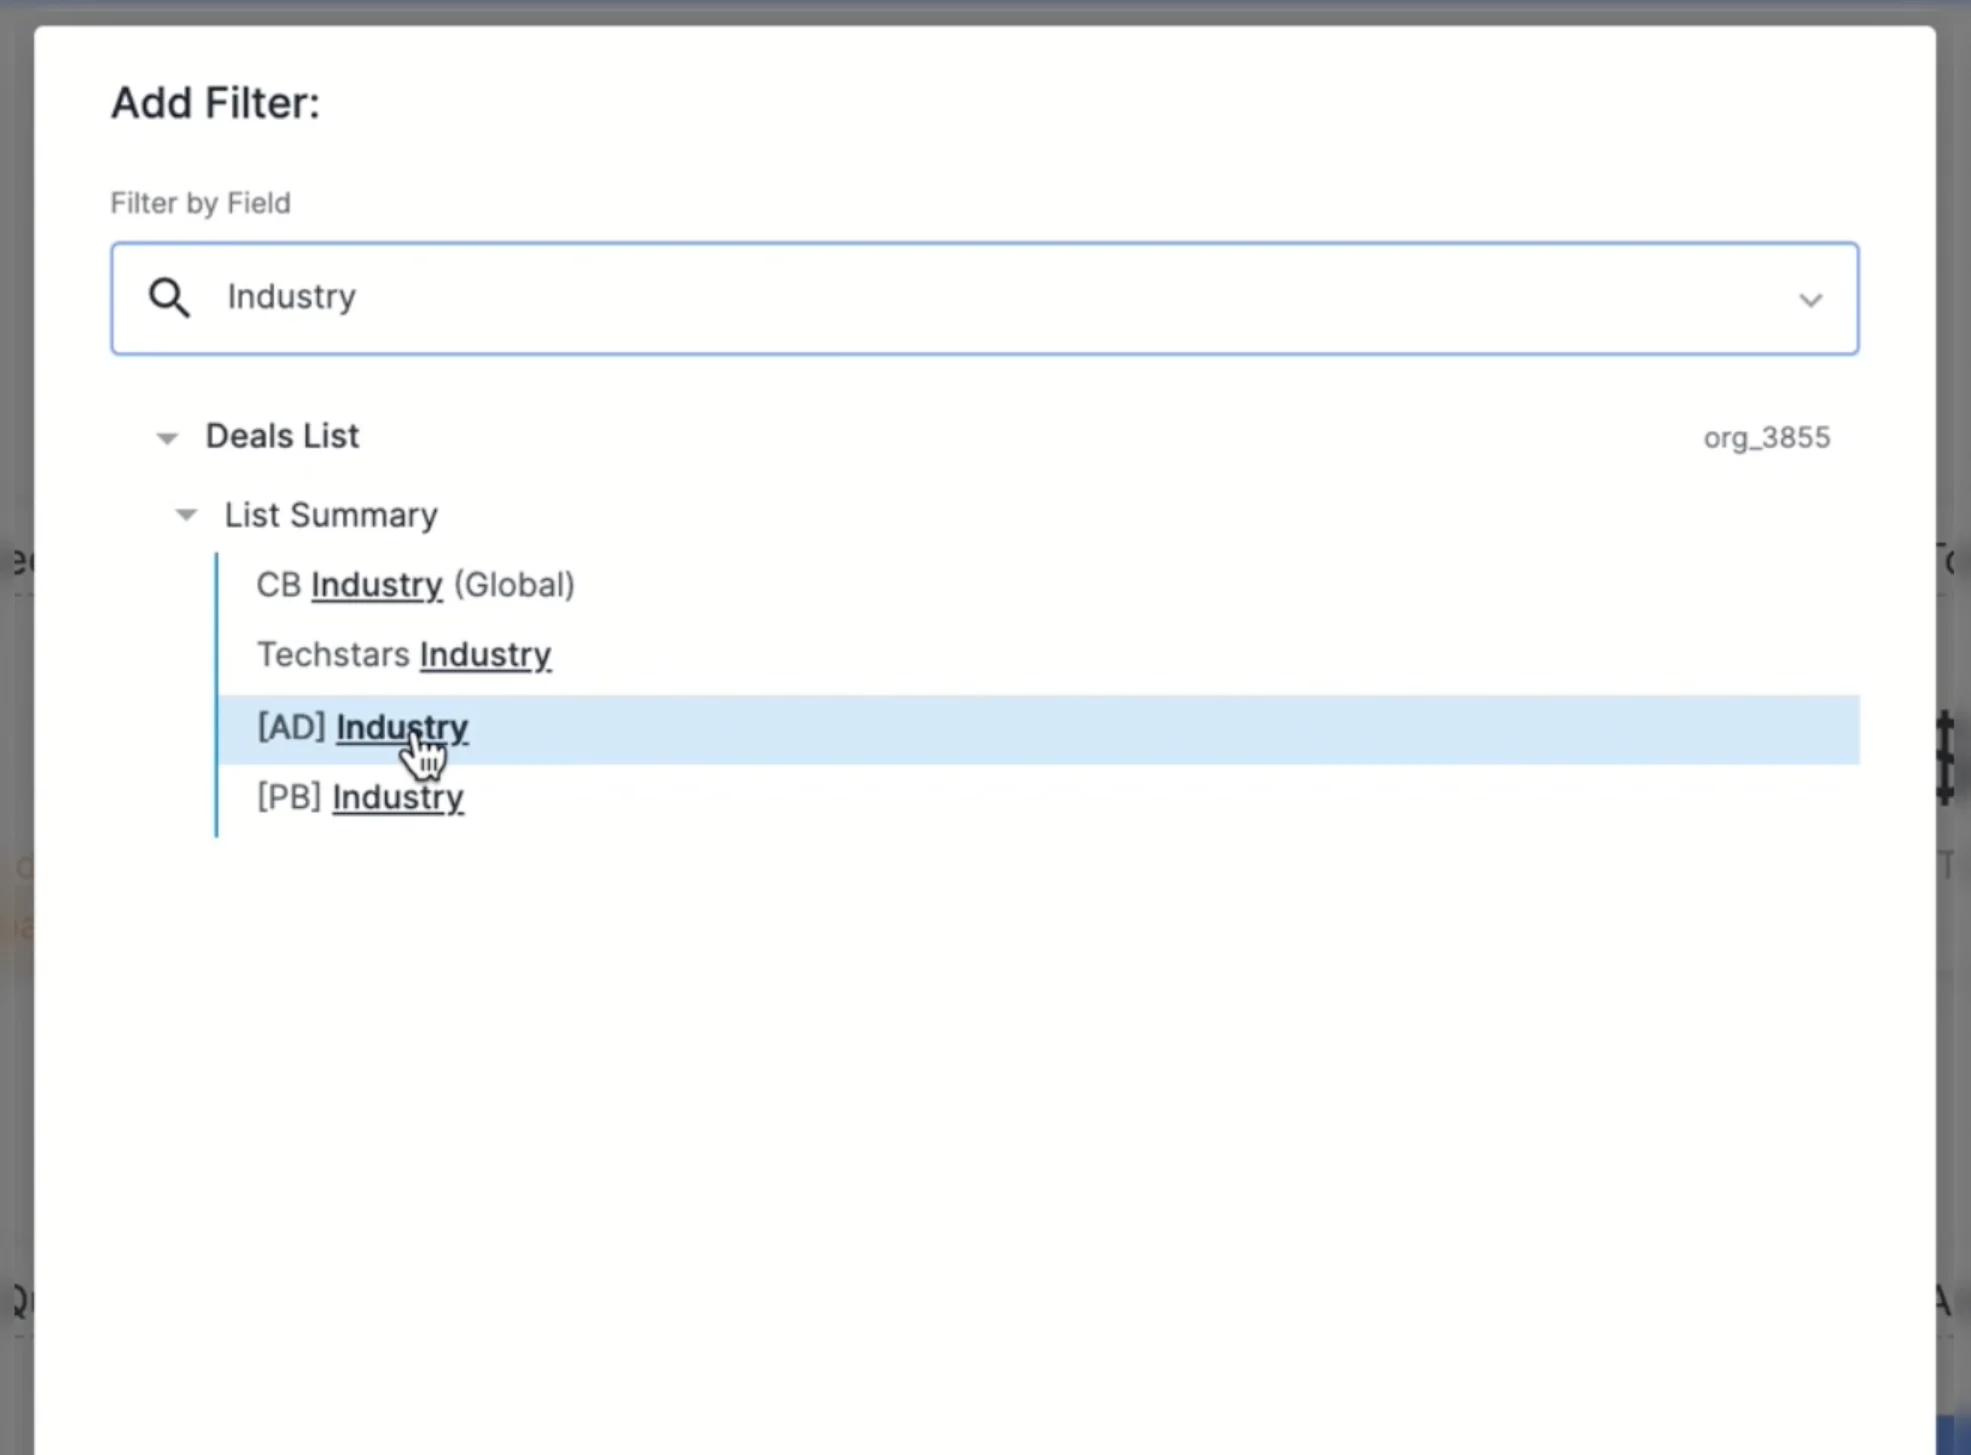
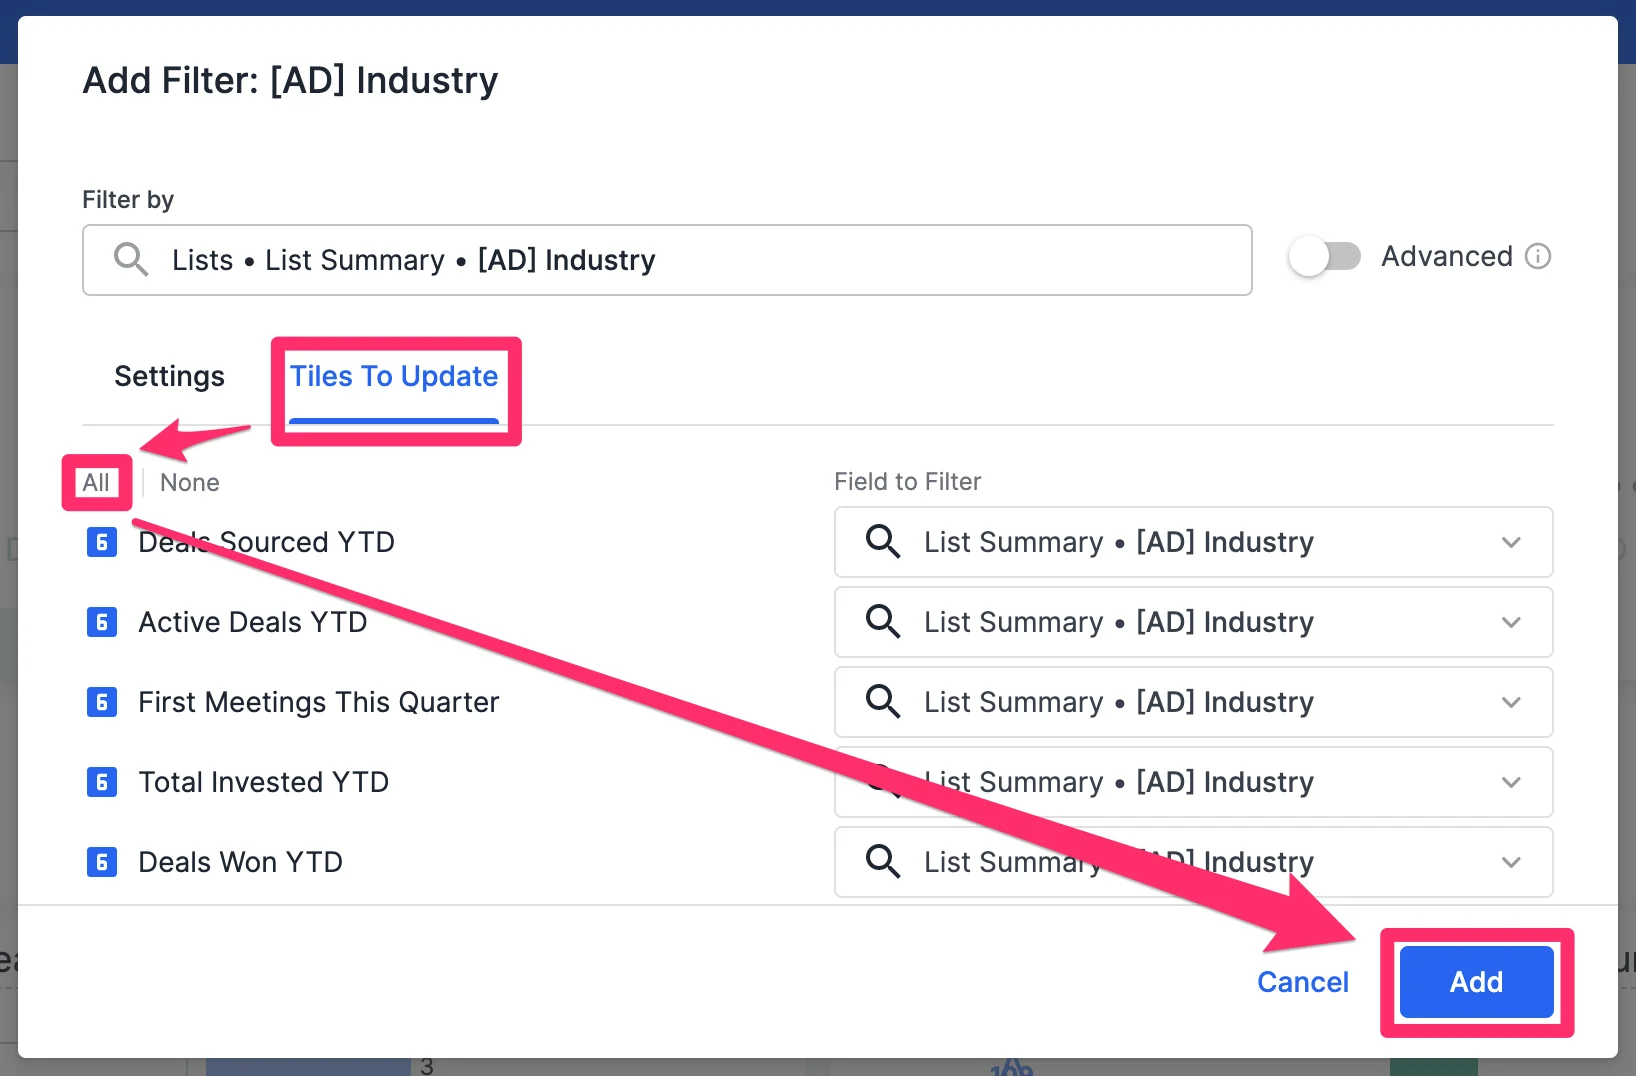
 3. Select the field that you want this filter to be based off of. In this example, we'll choose Affinity Data's **Industry** field.
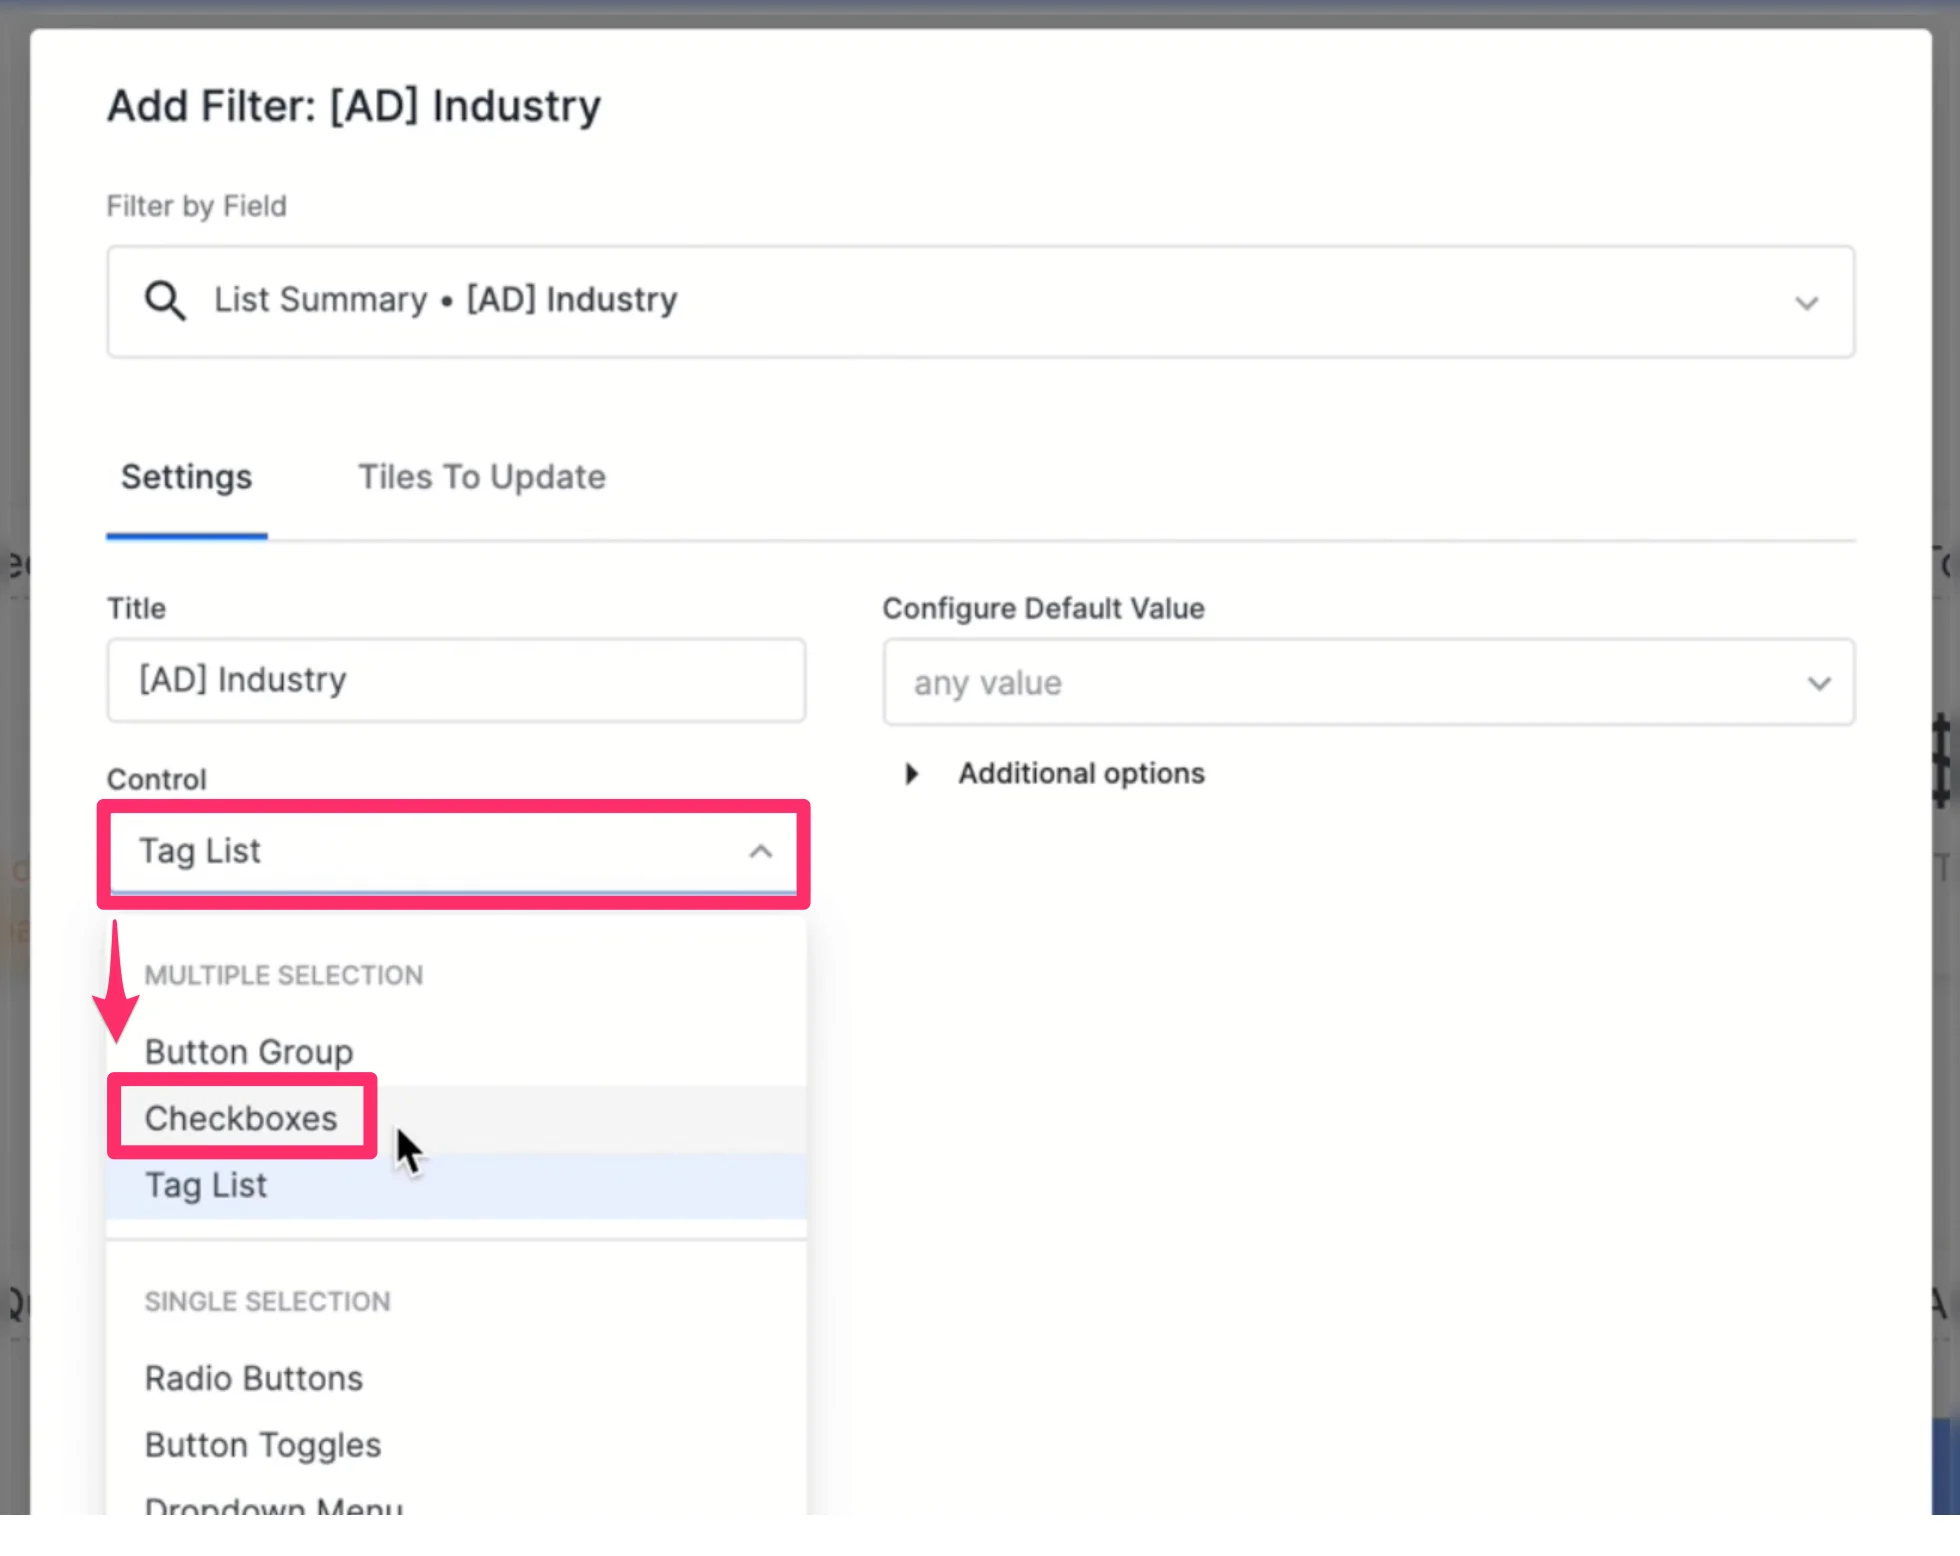
 4. Under the **Settings** tab, give a title for this filter - we simply recommend using the name of the field itself. We also recommend selecting **Checkboxes** for the Control and **Popover** for the Location, but feel free to also test out the other available options.
 5. Under the **Tiles to Update** tab, select which visualization tiles should be affected when the filter is applied.
1. You can either update all visualization tiles or select specific visualization tiles.
2. Afterwards, click **Add**.
5. Under the **Tiles to Update** tab, select which visualization tiles should be affected when the filter is applied.
1. You can either update all visualization tiles or select specific visualization tiles.
2. Afterwards, click **Add**.
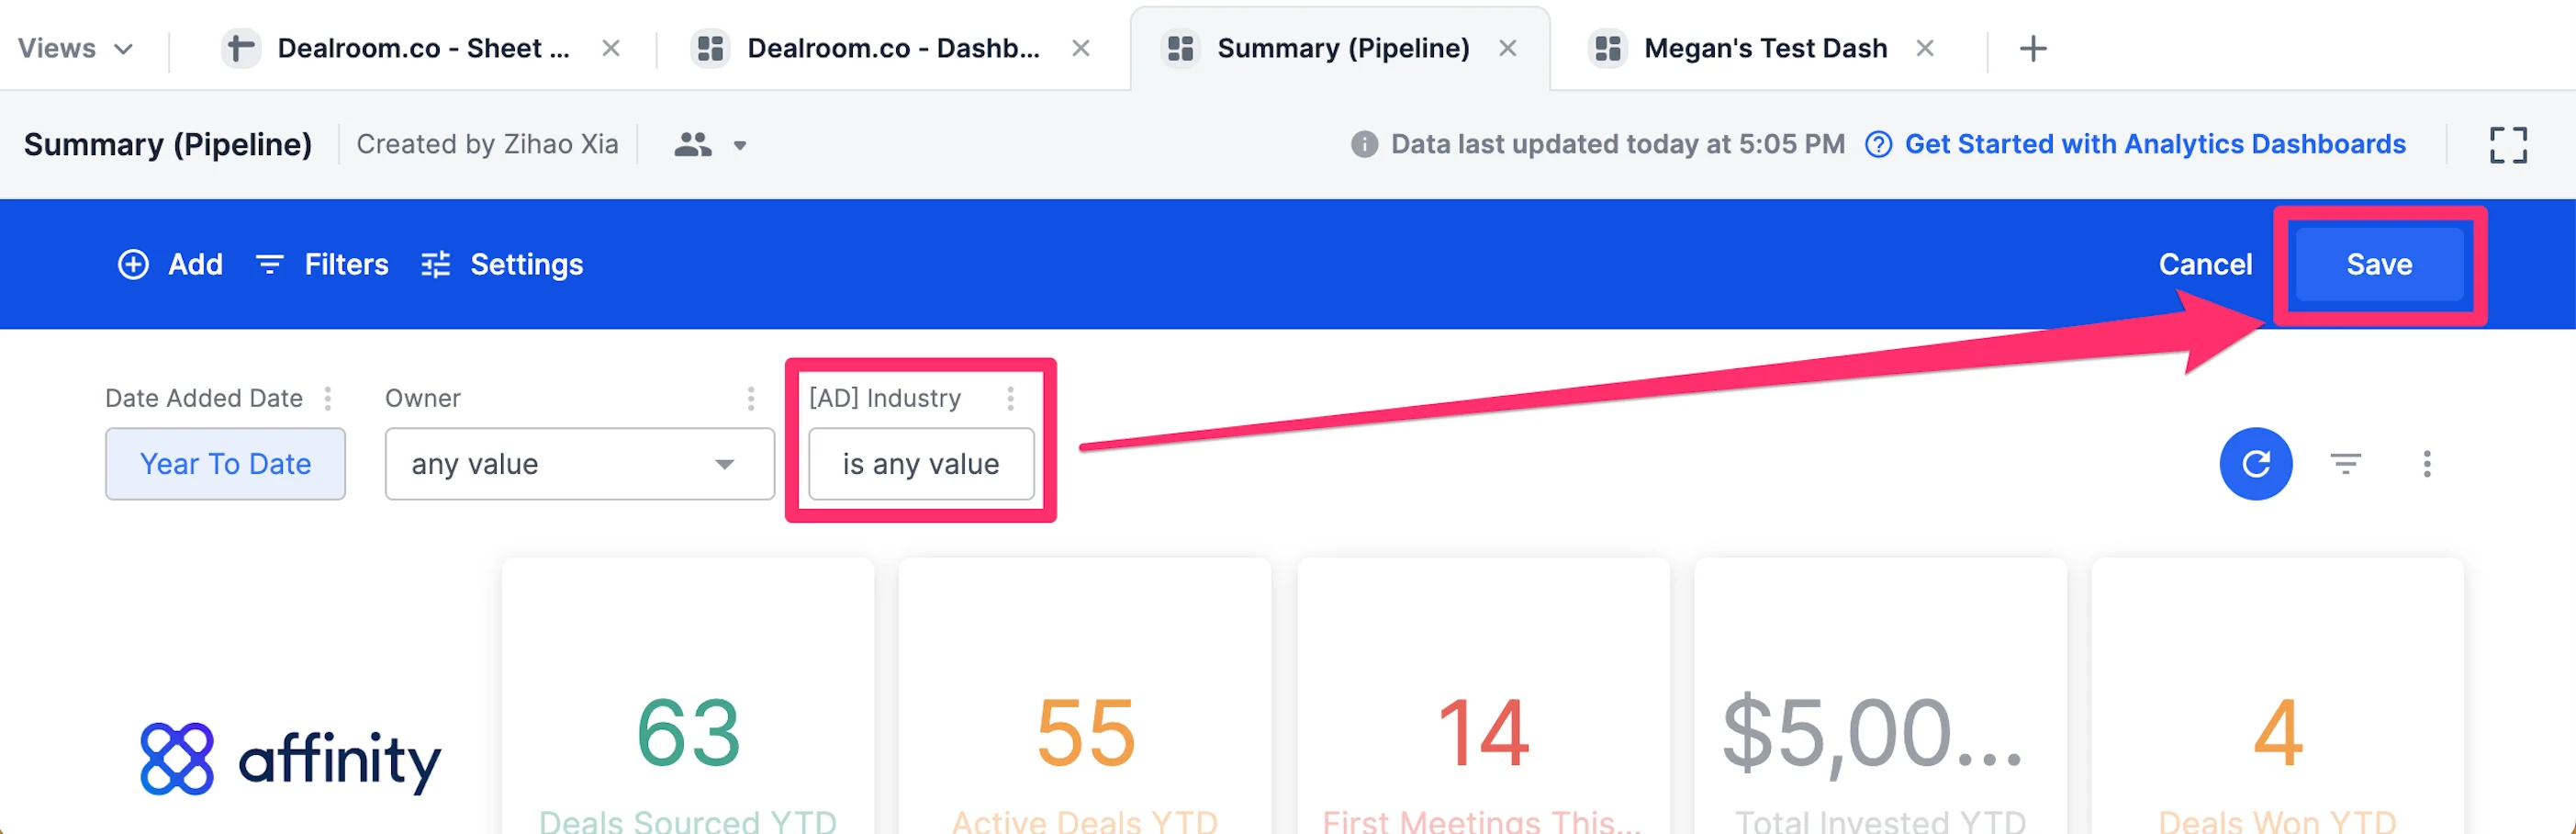
 6. Now, **Industry** will appear as a field you can filter by. Click **Save** and you're all set!
 ## How to conduct cross-filters on your dashboard views
Unlike the filters you must set up on the top of your dashboard, **cross-filters** enable you to quickly filter by specific data point(s) on a visualization tile and apply it to all other visualization tiles in the dashboard.
1. Click the **ellipsis (3-dotted icon)** in the dashboard, then click **Edit dashboard**.
## How to conduct cross-filters on your dashboard views
Unlike the filters you must set up on the top of your dashboard, **cross-filters** enable you to quickly filter by specific data point(s) on a visualization tile and apply it to all other visualization tiles in the dashboard.
1. Click the **ellipsis (3-dotted icon)** in the dashboard, then click **Edit dashboard**.
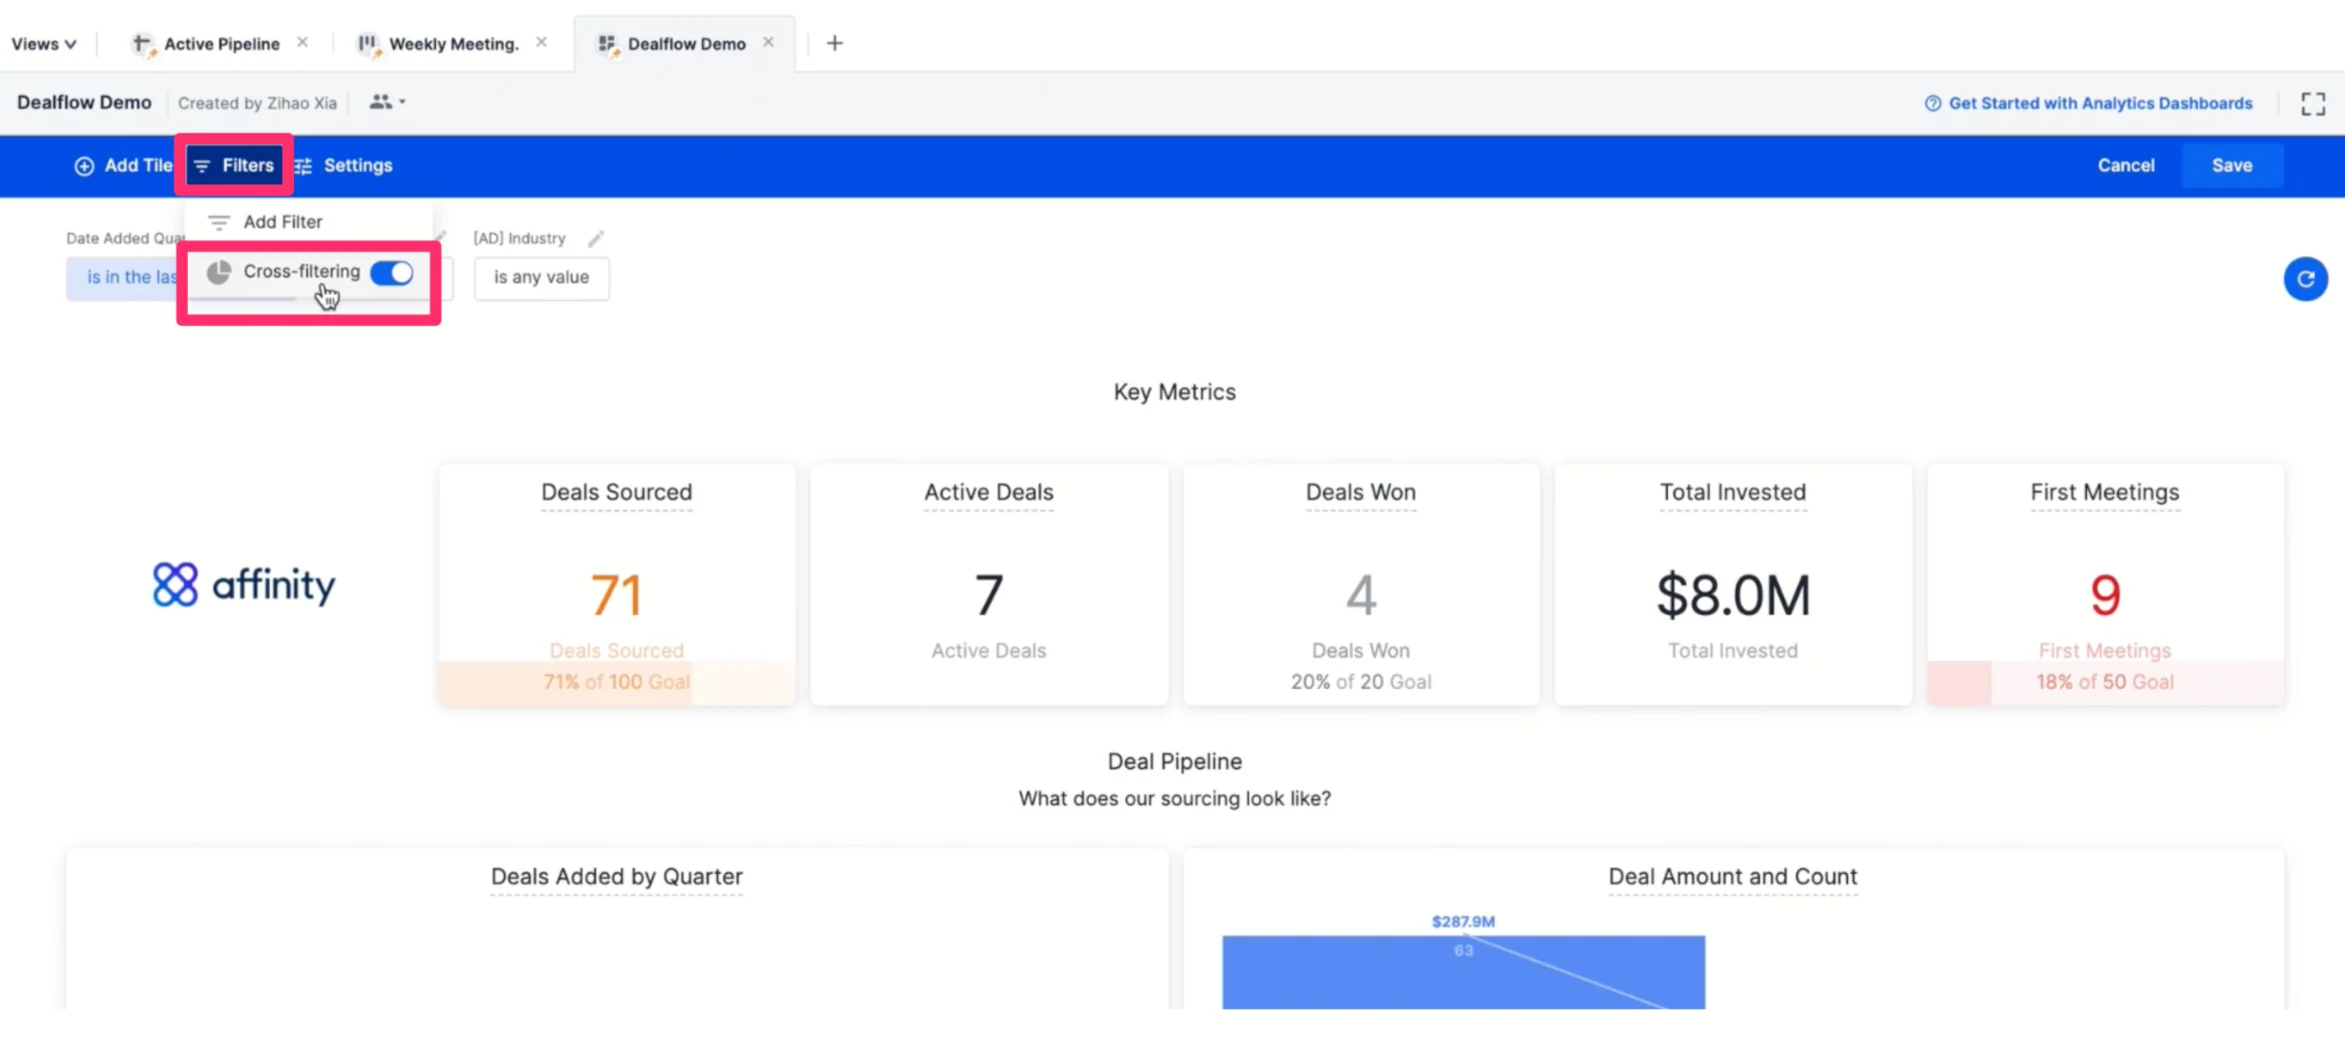
 2. Click **Filters**, then toggle on **Cross-filtering**.
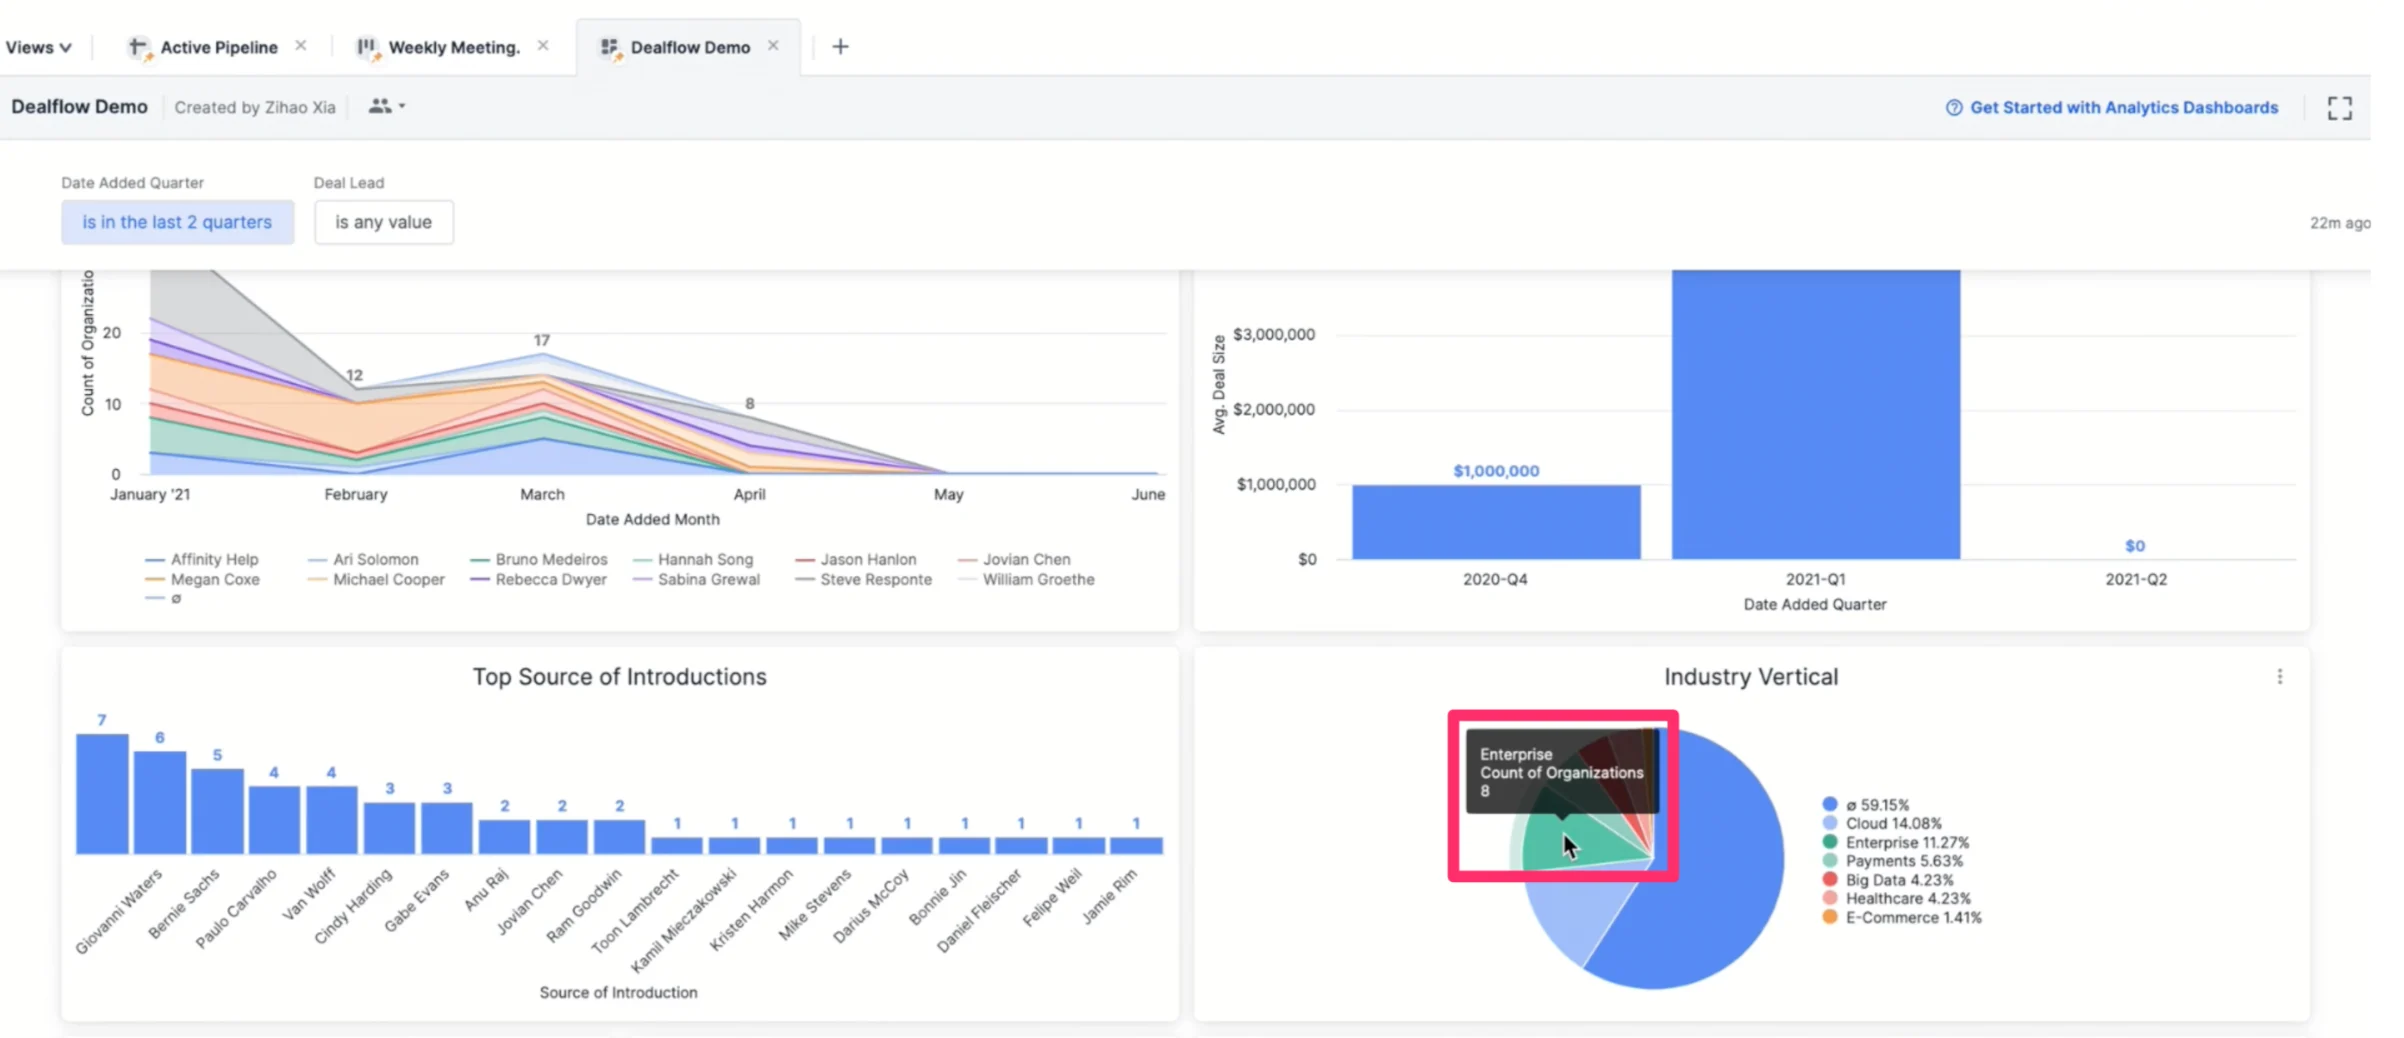
 3. Now, click on a specific data point on a visualization tile. In this example, we will choose "Enterprise" as the data point to cross-filter by.
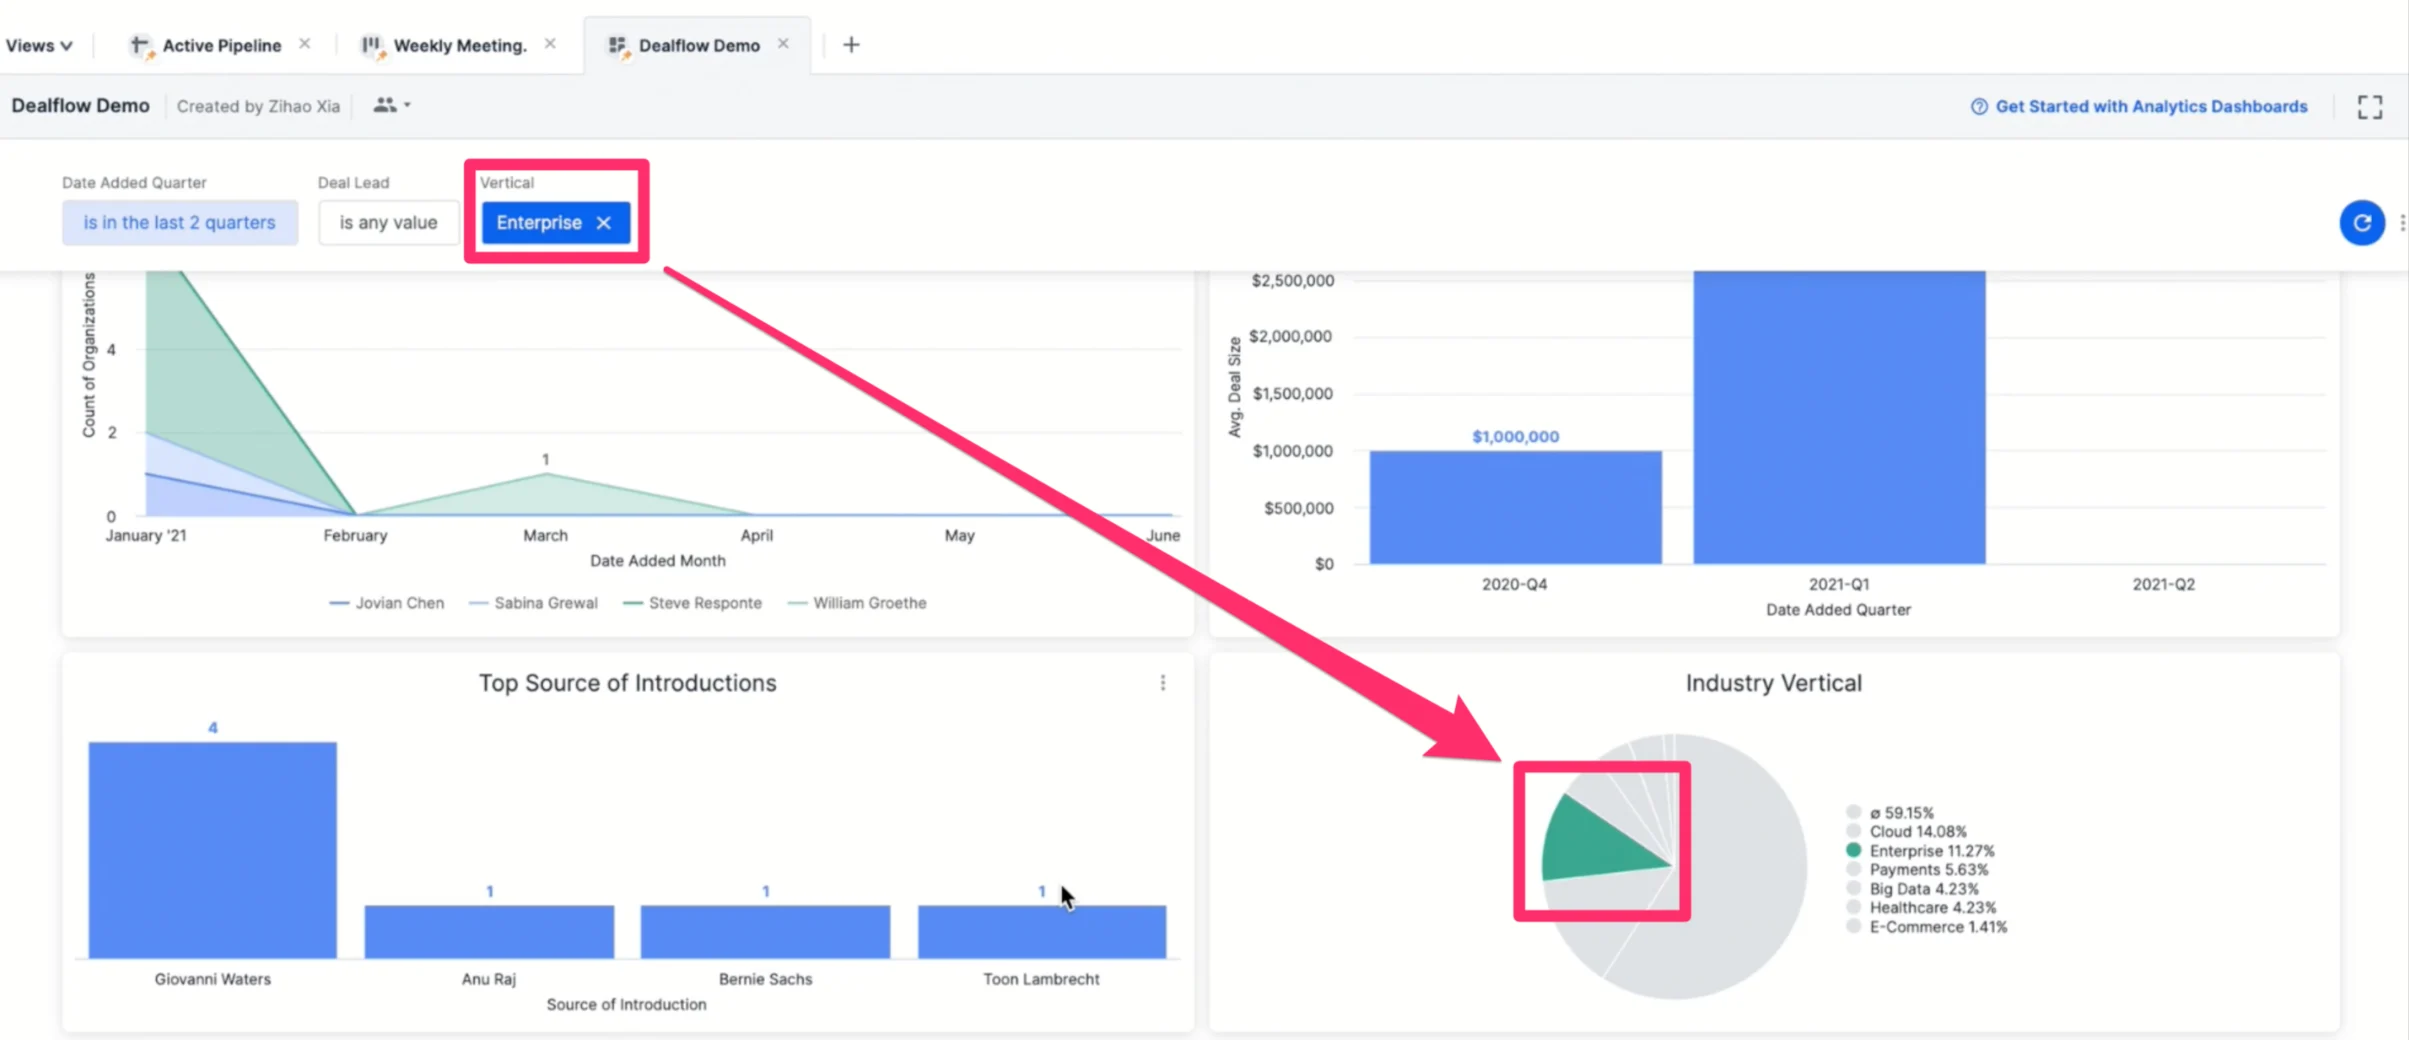
 4. All other visualization tiles that support cross-filtering will now be filtered by the "Enterprise" data point (see below).
 5. To add more data points to cross-filter by, press **Command** + **click** (on Mac keyboards) or **Control** + **click** (on PC keyboards) on the additional data points.
## How to apply filters to a specific tile
Rather than applying filters across all visualization tiles, you can also apply filters to just one tile.
1. Click the **ellipsis (3-dotted icon)** in the dashboard, then click **Edit dashboard**.
5. To add more data points to cross-filter by, press **Command** + **click** (on Mac keyboards) or **Control** + **click** (on PC keyboards) on the additional data points.
## How to apply filters to a specific tile
Rather than applying filters across all visualization tiles, you can also apply filters to just one tile.
1. Click the **ellipsis (3-dotted icon)** in the dashboard, then click **Edit dashboard**.
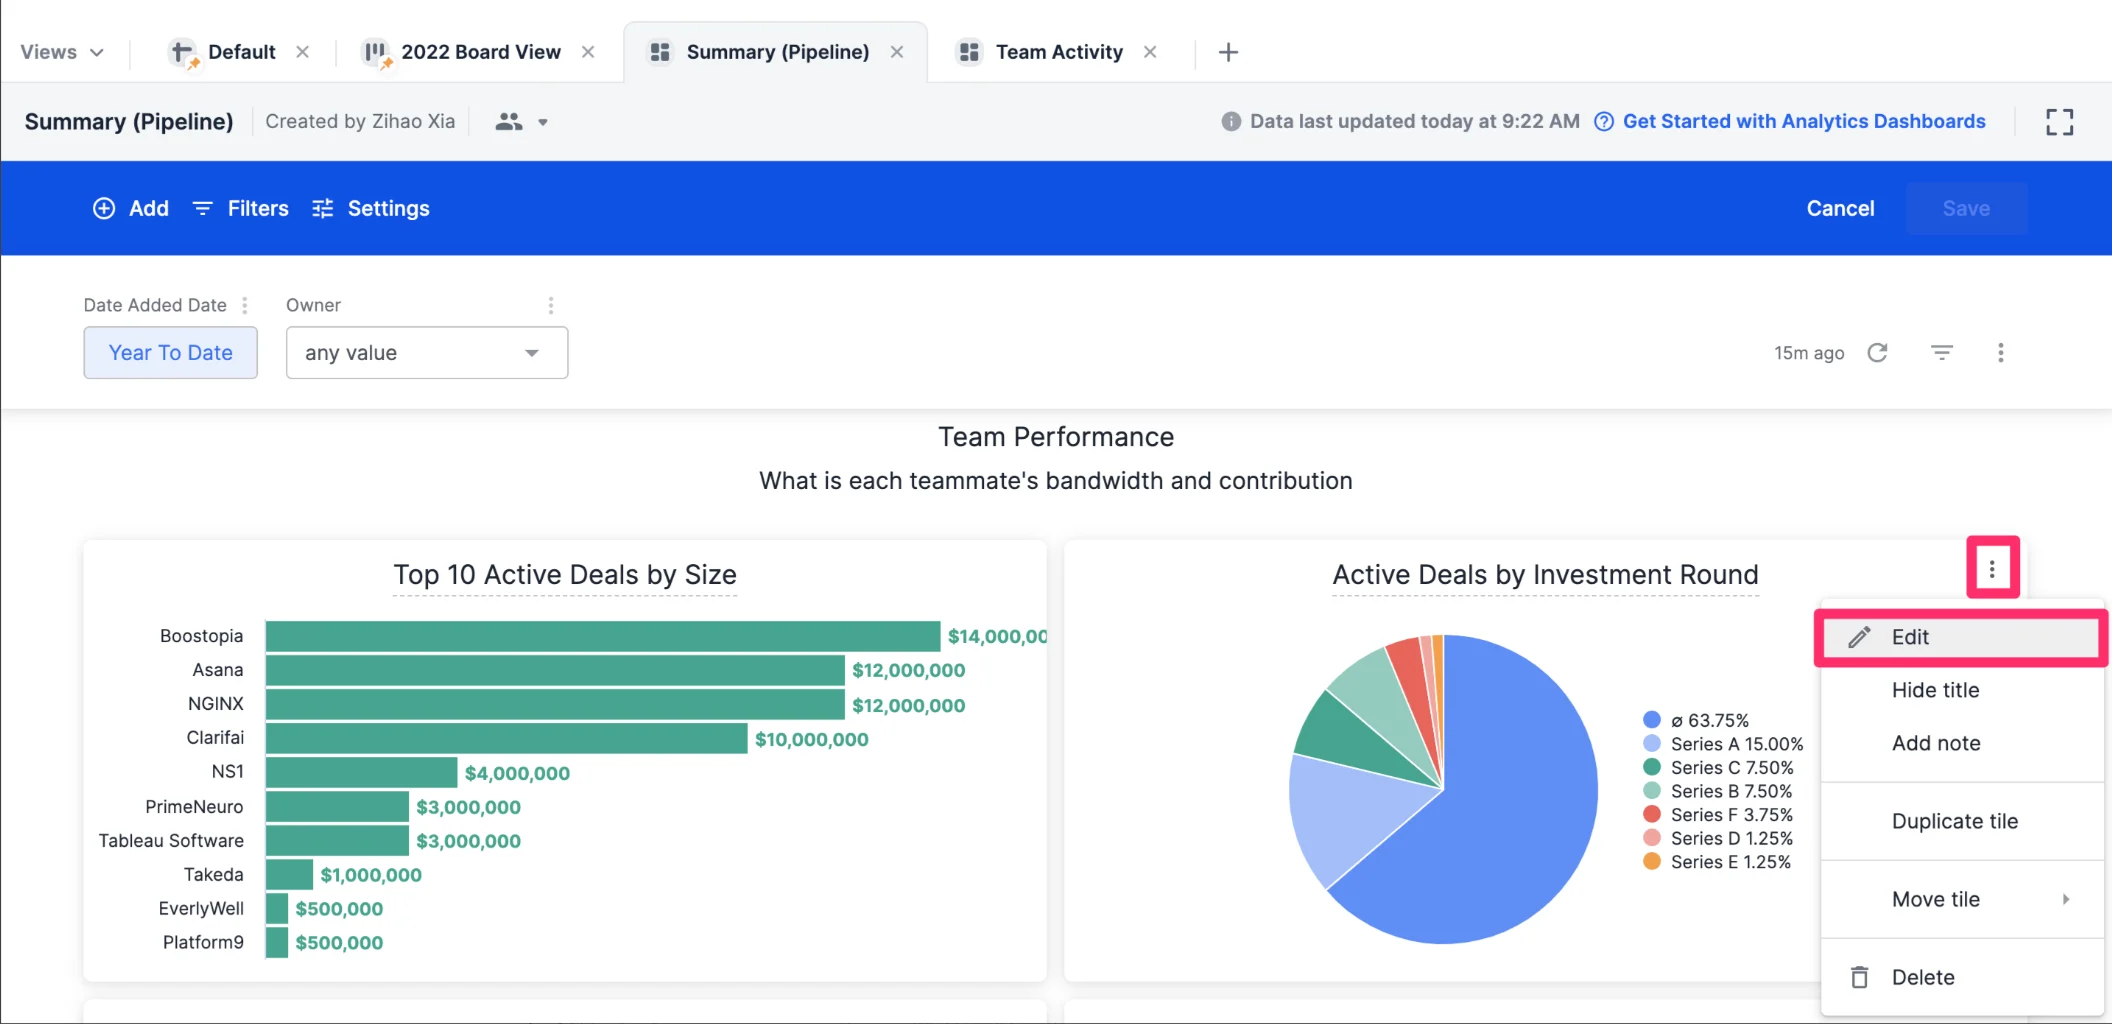
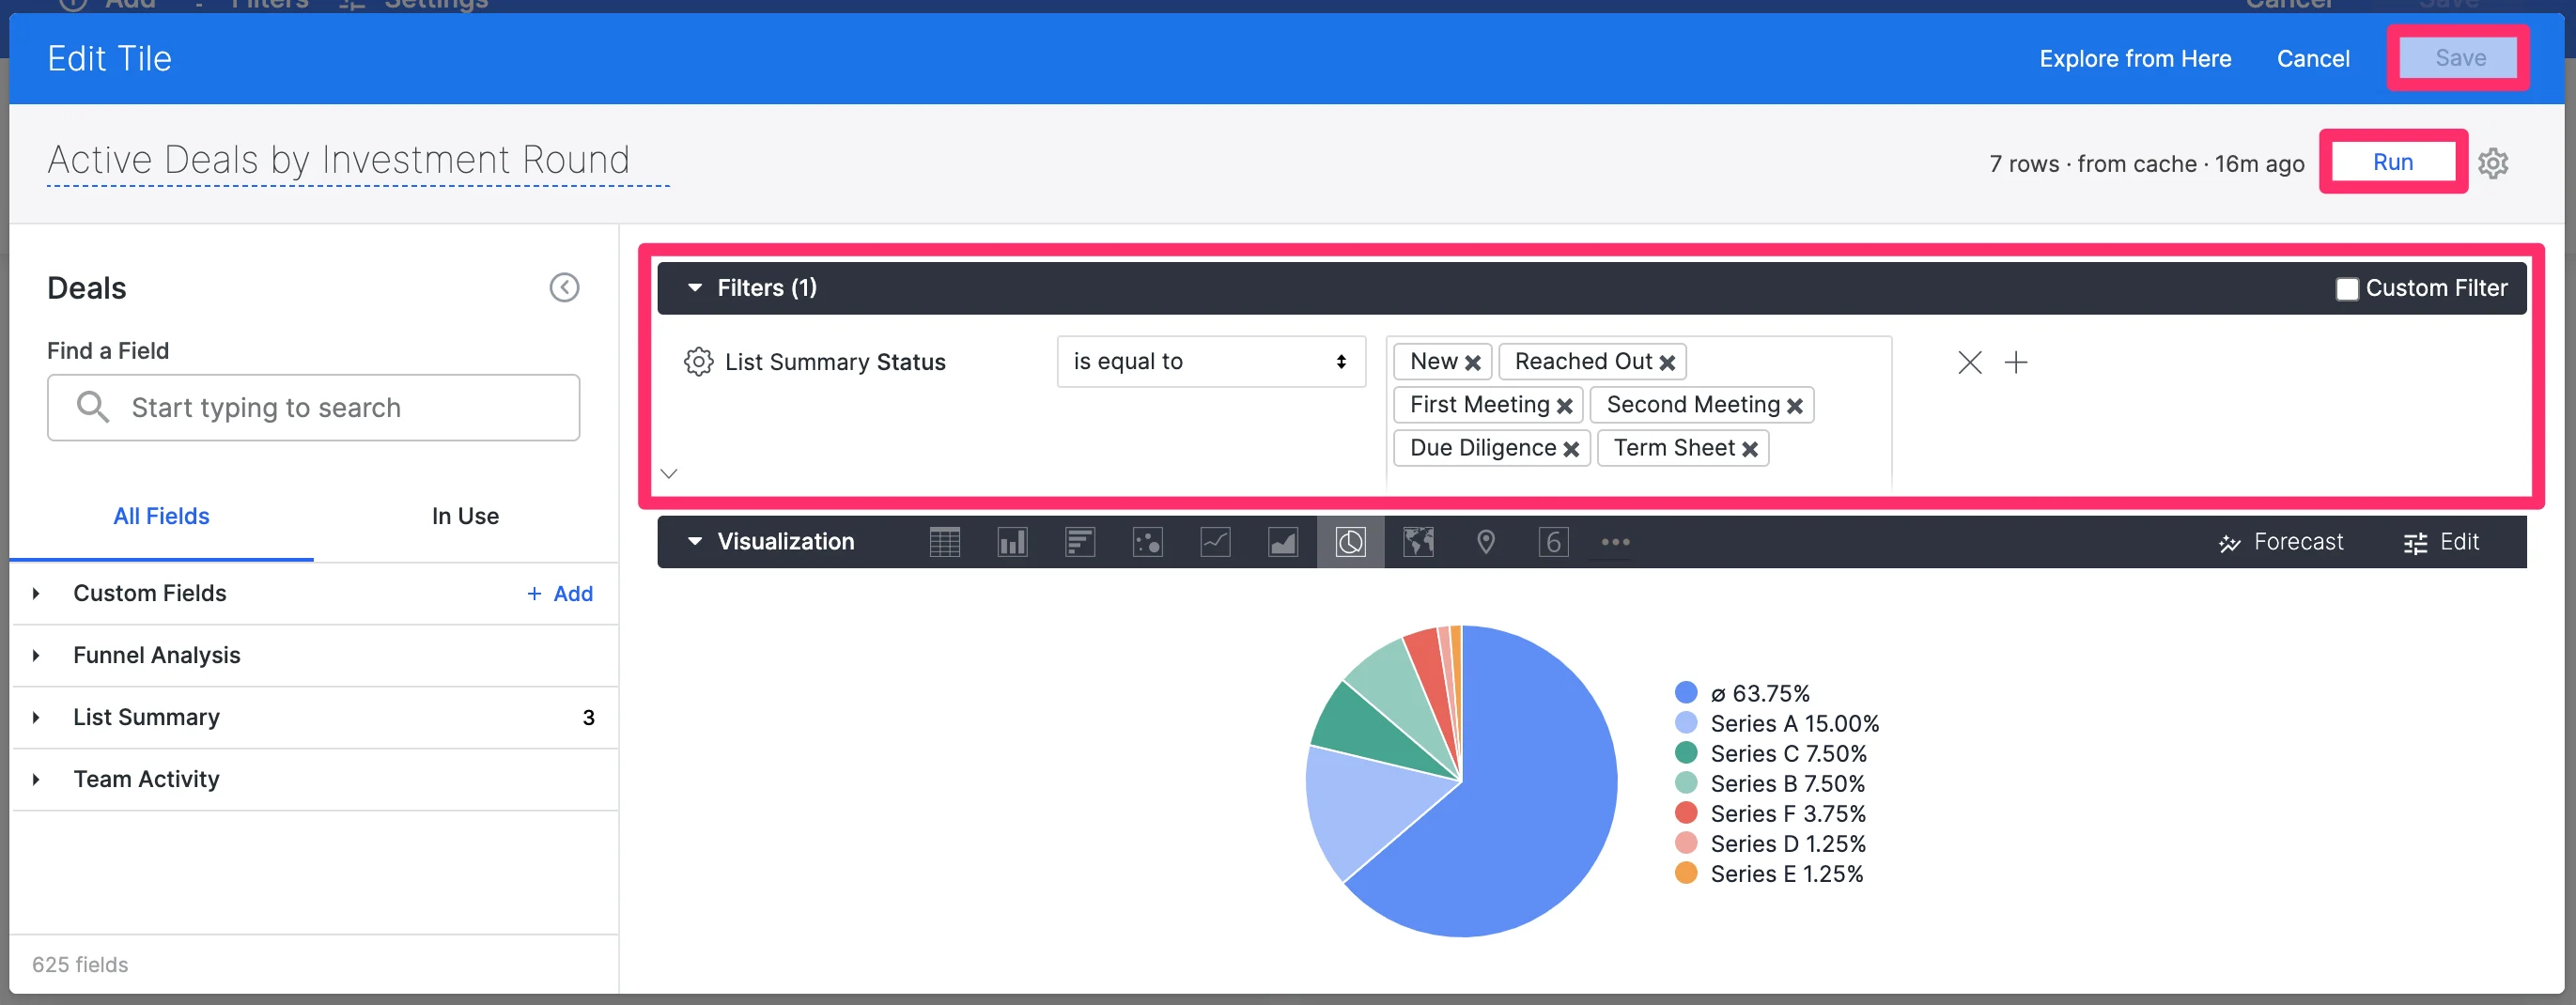
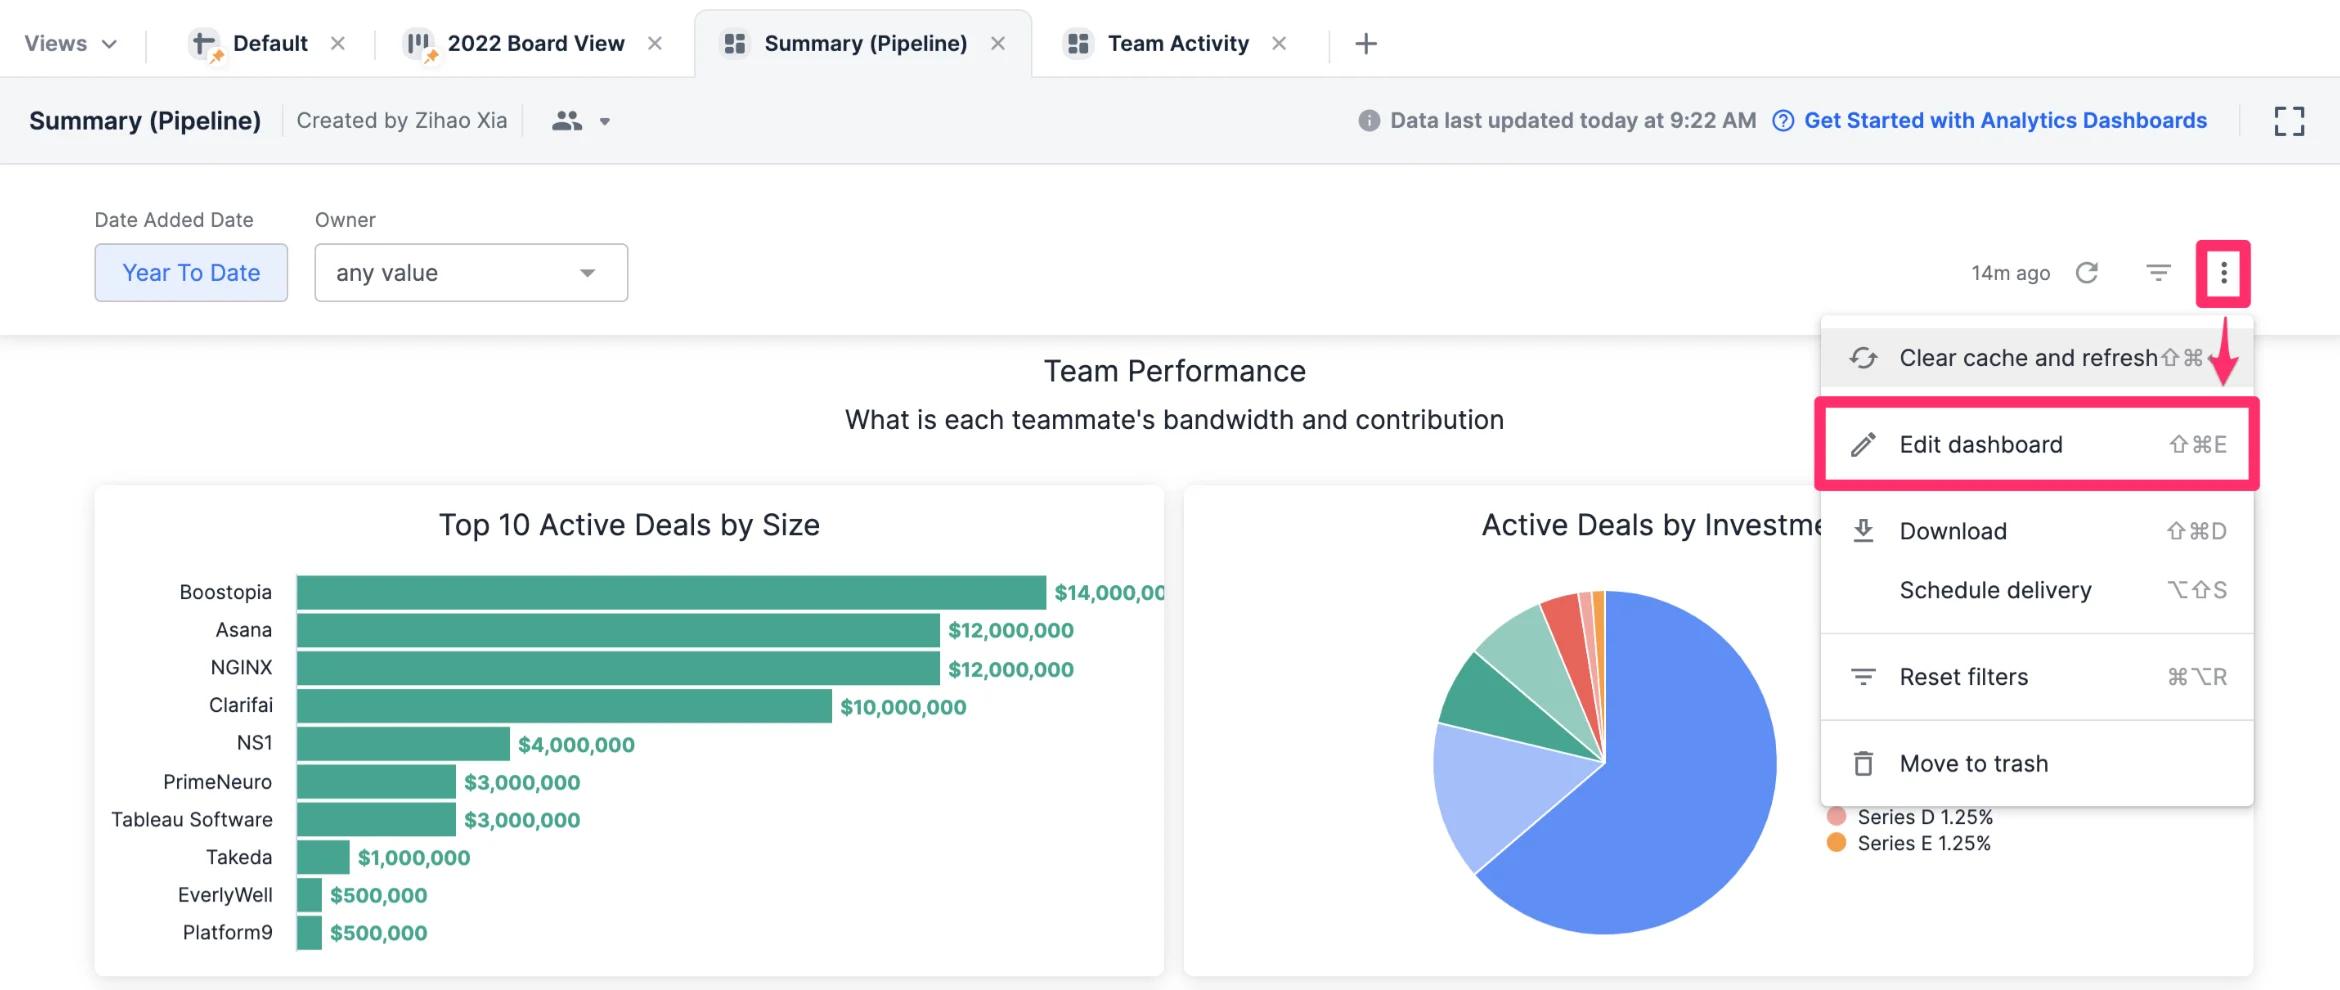 2. Click the **ellipsis (3-dotted icon)** on the specific tile you'd like to apply filters to, then click **Edit tile**.
 3. Make changes in the **Filter** section, then click **Run**, and finally, click **Save**.
**Important Callout**: If you're applying a filter for **relative dates** (a certain number of days into the past or the future based on today), we highly suggest using "**days**" instead of "**weeks**" (see "Relative dates" section in this [Looker article](https://cloud.google.com/looker/docs/filter-expressions#date_and_time)).
3. Make changes in the **Filter** section, then click **Run**, and finally, click **Save**.
**Important Callout**: If you're applying a filter for **relative dates** (a certain number of days into the past or the future based on today), we highly suggest using "**days**" instead of "**weeks**" (see "Relative dates" section in this [Looker article](https://cloud.google.com/looker/docs/filter-expressions#date_and_time)).
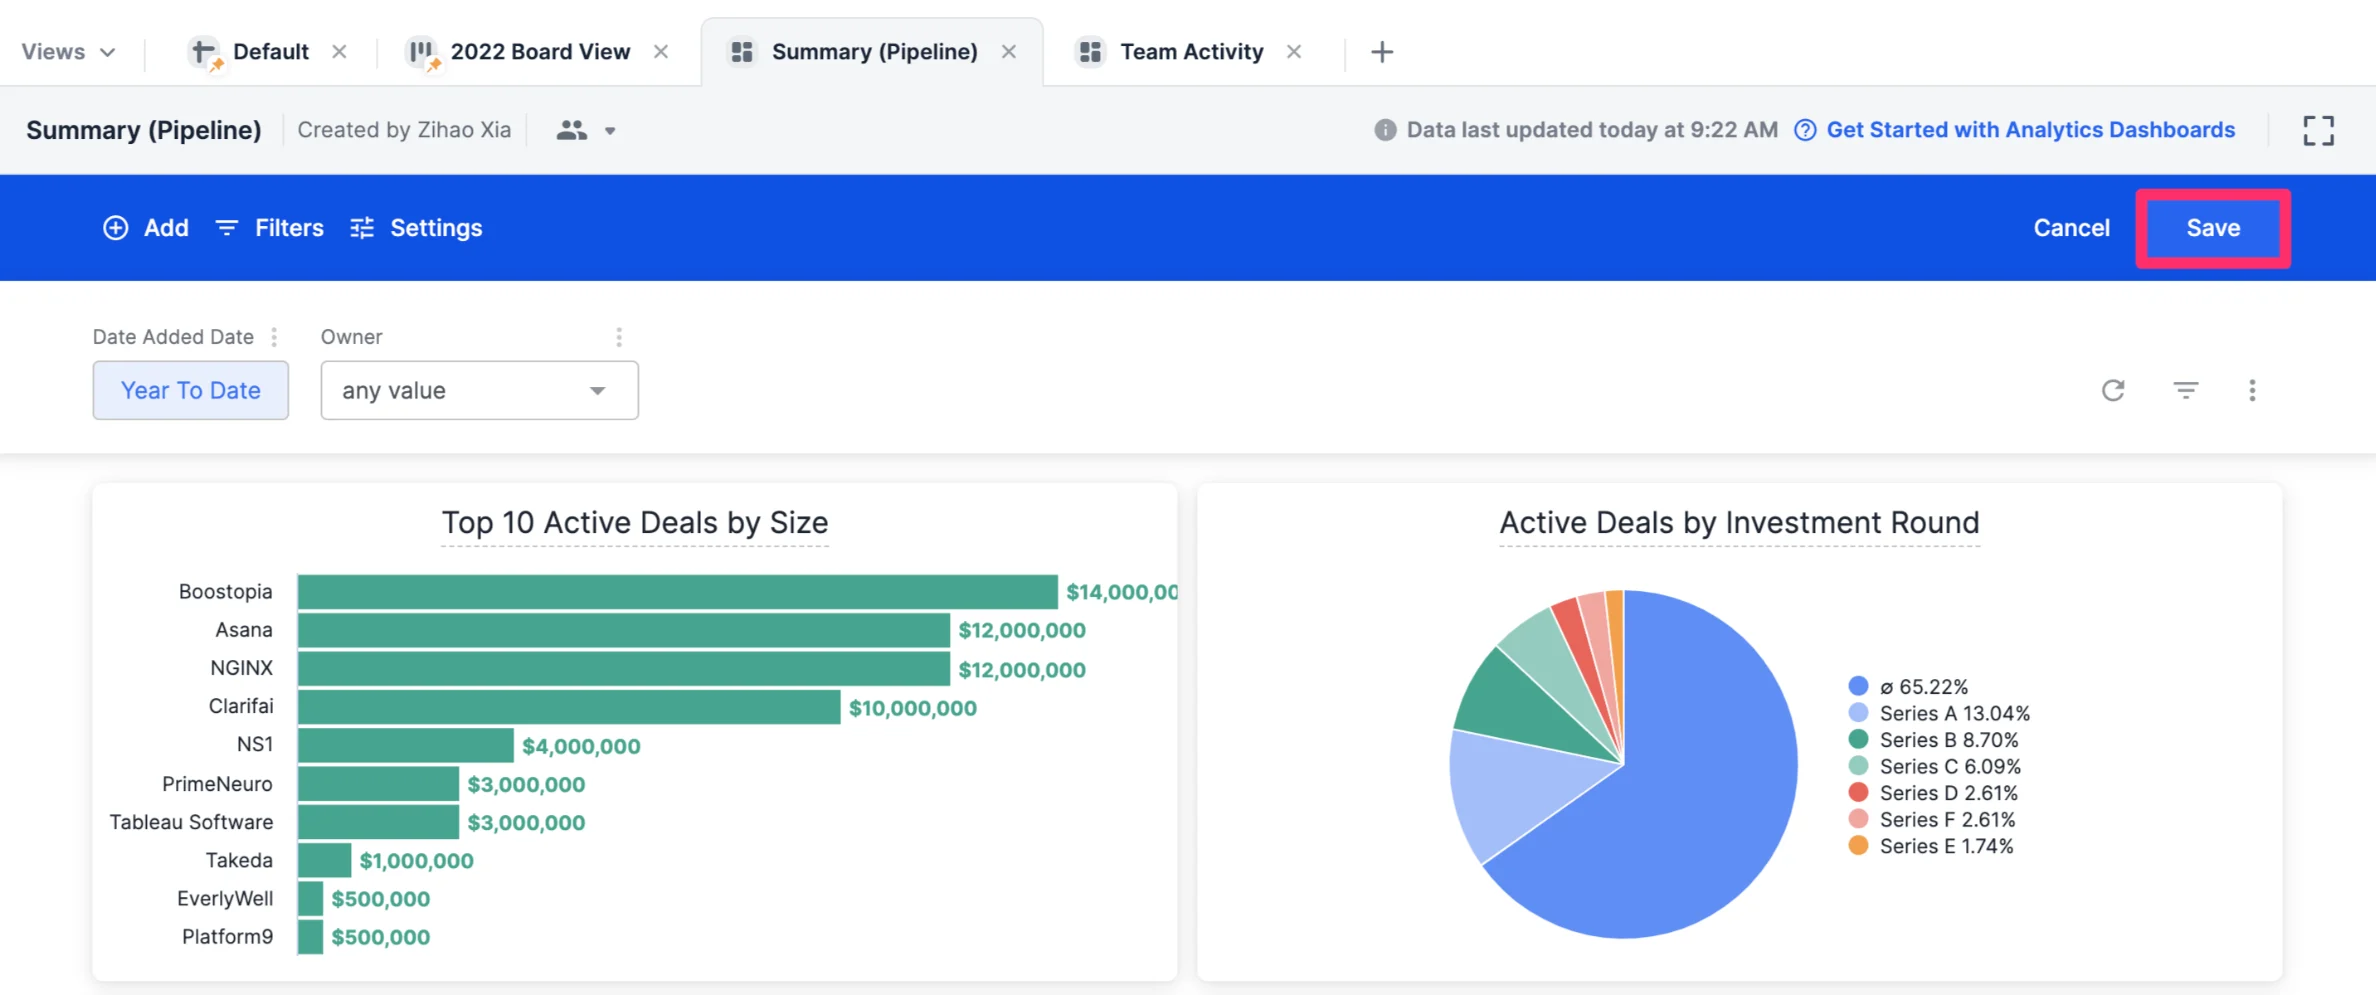
 4. Make sure to save the changes made to the entire dashboard view by clicking **Save** one more time, and you're all set.
 ## Related topics
- [How To Create And Edit Tiles In Dashboard Views](/s/article/How-to-create-and-edit-tiles-in-dashboard-views.md)
- [How To Export Dashboard Views](/s/article/How-to-export-dashboard-views.md)
- [How To Create A Dashboard View](/s/article/How-to-create-a-dashboard-view.md)
- [How To Duplicate Tiles And Dashboard Views In Affinity](/s/article/How-to-duplicate-tiles-and-dashboard-views-in-Affinity.md)
- [How To Pivot Data On Your Dashboard Views](/s/article/How-to-pivot-data-on-your-dashboard-views.md)
## Related topics
- [How To Create And Edit Tiles In Dashboard Views](/s/article/How-to-create-and-edit-tiles-in-dashboard-views.md)
- [How To Export Dashboard Views](/s/article/How-to-export-dashboard-views.md)
- [How To Create A Dashboard View](/s/article/How-to-create-a-dashboard-view.md)
- [How To Duplicate Tiles And Dashboard Views In Affinity](/s/article/How-to-duplicate-tiles-and-dashboard-views-in-Affinity.md)
- [How To Pivot Data On Your Dashboard Views](/s/article/How-to-pivot-data-on-your-dashboard-views.md)