> ## Documentation Index
> Fetch the complete documentation index at: https://support.affinity.co/llms.txt
> Use this file to discover all available pages before exploring further.
# Getting Started With Affinity Analytics
> Help center reference
**Reference** — lookup information.
Powered by Looker, Affinity Analytics will enable you to create new, robust visualizations of your data and share them with others on a recurring basis.
### Who can access Affinity Analytics?
| **Essential** | **Scale** | **Advanced** | **Enterprise** |
| ------------- | --------- | ------------ | -------------- |
| No | Yes | Yes | Yes |
Interested in upgrading to **Scale**, **Advanced**, or **Enterprise**? Please reach out to your Affinity point of contact or [support@affinity.co](mailto:support@affinity.co).
### Understanding your role (Viewer or Creator)
* When Affinity Analytics is turned on for your account, all **Enterprise Admins** (for **Enterprise** tier customers) and **Admins** in the account will be assigned the **Creator** role by default.
* On the other hand, all **Standard** users will be assigned the **Viewer** role by default.
* Want to switch from a **Viewer** to a **Creator**?
* Please reach out to [support@affinity.co](mailto:support@affinity.co) with one of your admins CC'ed on the email thread.
* Not sure who your admins are? Check out the section "How to find your account role and view permissions for each role" in the article [Account Level Permissions](/s/article/Account-level-permissions).
* Last but not least, have them provide written permission agreeing to your request. Once doing so, our Support Team can change your role accordingly.
| **Actions to take** | **Viewer** | **Creator** |
| --------------------------------------------------- | ---------------------------- | --------------------- |
| Create a new dashboard view from existing template | | Yes |
| Create a new dashboard view from scratch | | Yes |
| Edit/Delete dashboard views within a list | | Yes |
| Set up filters and cross-filters on dashboard views | | Yes |
| Use filters and cross-filters on dashboard views | Yes | Yes |
| Rename dashboard views | Yes | Yes |
| Email a dashboard view | Yes (email only to yourself) | Yes (email to anyone) |
| Export dashboard views as PDF/CSV files | Yes | Yes |
| Drill into underlying data in visualization tiles | Yes | Yes |
### Starting with the basics
Once you have access to Affinity Analytics, you can start with our [Creating Visualizations](/s/article/Affinity-Analytics-Creating-Visualizations) video series. Then, click on the links below if you'd like to focus on a particular step in the overall process - we suggest watching them in sequential order:
1. [How to create a new dashboard view (Creators only)](/s/article/How-to-create-a-dashboard-view)
1. [Affinity Analytics - List Summary Reports](/s/article/Affinity-Analytics-List-Summary-Reports)
2. [Affinity Analytics - Introductions Summary Reports](/s/article/Affinity-Analytics-Introductions-Summary-Reports)
3. [Affinity Analytics - Team Activity Reports](/s/article/Affinity-Analytics-Team-Activity-Reports)
4. [Affinity Analytics - Funnel Analysis Reports](/s/article/Affinity-Analytics-Funnel-Analysis-Reports)
2. [How to create and edit tiles in dashboard views](/s/article/How-to-create-and-edit-tiles-in-dashboard-views)
3. [How to apply filters in dashboard views](/s/article/How-to-apply-filters-in-dashboard-views)
4. [How to pivot data on your dashboard views](/s/article/How-to-pivot-data-on-your-dashboard-views)
5. [How to export dashboard views (for yourself and others)](/s/article/How-to-export-dashboard-views)
6. [How to set up automated alerts for Affinity Analytics](/s/article/How-to-set-up-automated-alerts-for-Affinity-Analytics)
7. [How to duplicate tiles and dashboard views in Affinity](/s/article/How-to-duplicate-tiles-and-dashboard-views-in-Affinity)
8. [Troubleshooting common issues for Affinity Analytics](/s/article/Troubleshooting-common-issues-for-Affinity-Analytics)
### Moving on to more advanced features
Once you're familiar with the basics, feel free to check out the more advanced visualizations you can create:
1. [How to set win ratios in Affinity Analytics](/s/article/How-to-set-win-ratios-in-Affinity-Analytics)
2. [How to set and track goals using Affinity Analytics](/s/article/How-to-set-and-track-goals-using-Affinity-Analytics)
3. [How to create custom groups in dashboard views](/s/article/How-to-create-custom-groups-in-dashboard-views)
4. [How to create custom dimensions, measures, and calculations in Affinity Analytics](/s/article/How-to-create-custom-dimensions-measures-and-calculations-in-Affinity-Analytics)
5. [How to track average days spent in each status using Affinity Analytics](/s/article/How-to-track-average-days-spent-in-each-status-using-Affinity-Analytics)
6. [How to track last status before Lost or Passed using Affinity Analytics](/s/article/How-to-track-last-status-before-Lost-or-Passed-using-Affinity-Analytics)
7. [How to create probability-adjusted values for forecasting with Affinity Analytics](/s/article/How-to-create-probability-adjusted-values-for-forecasting-with-Affinity-Analytics)
### Frequently Asked Questions
**How often does Affinity Analytics refresh the underlying data?**
* Affinity Analytics will refresh the underlying data once every 20-40 minutes.
**How can I tell if I am a Creator or a Viewer for Affinity Analytics?**
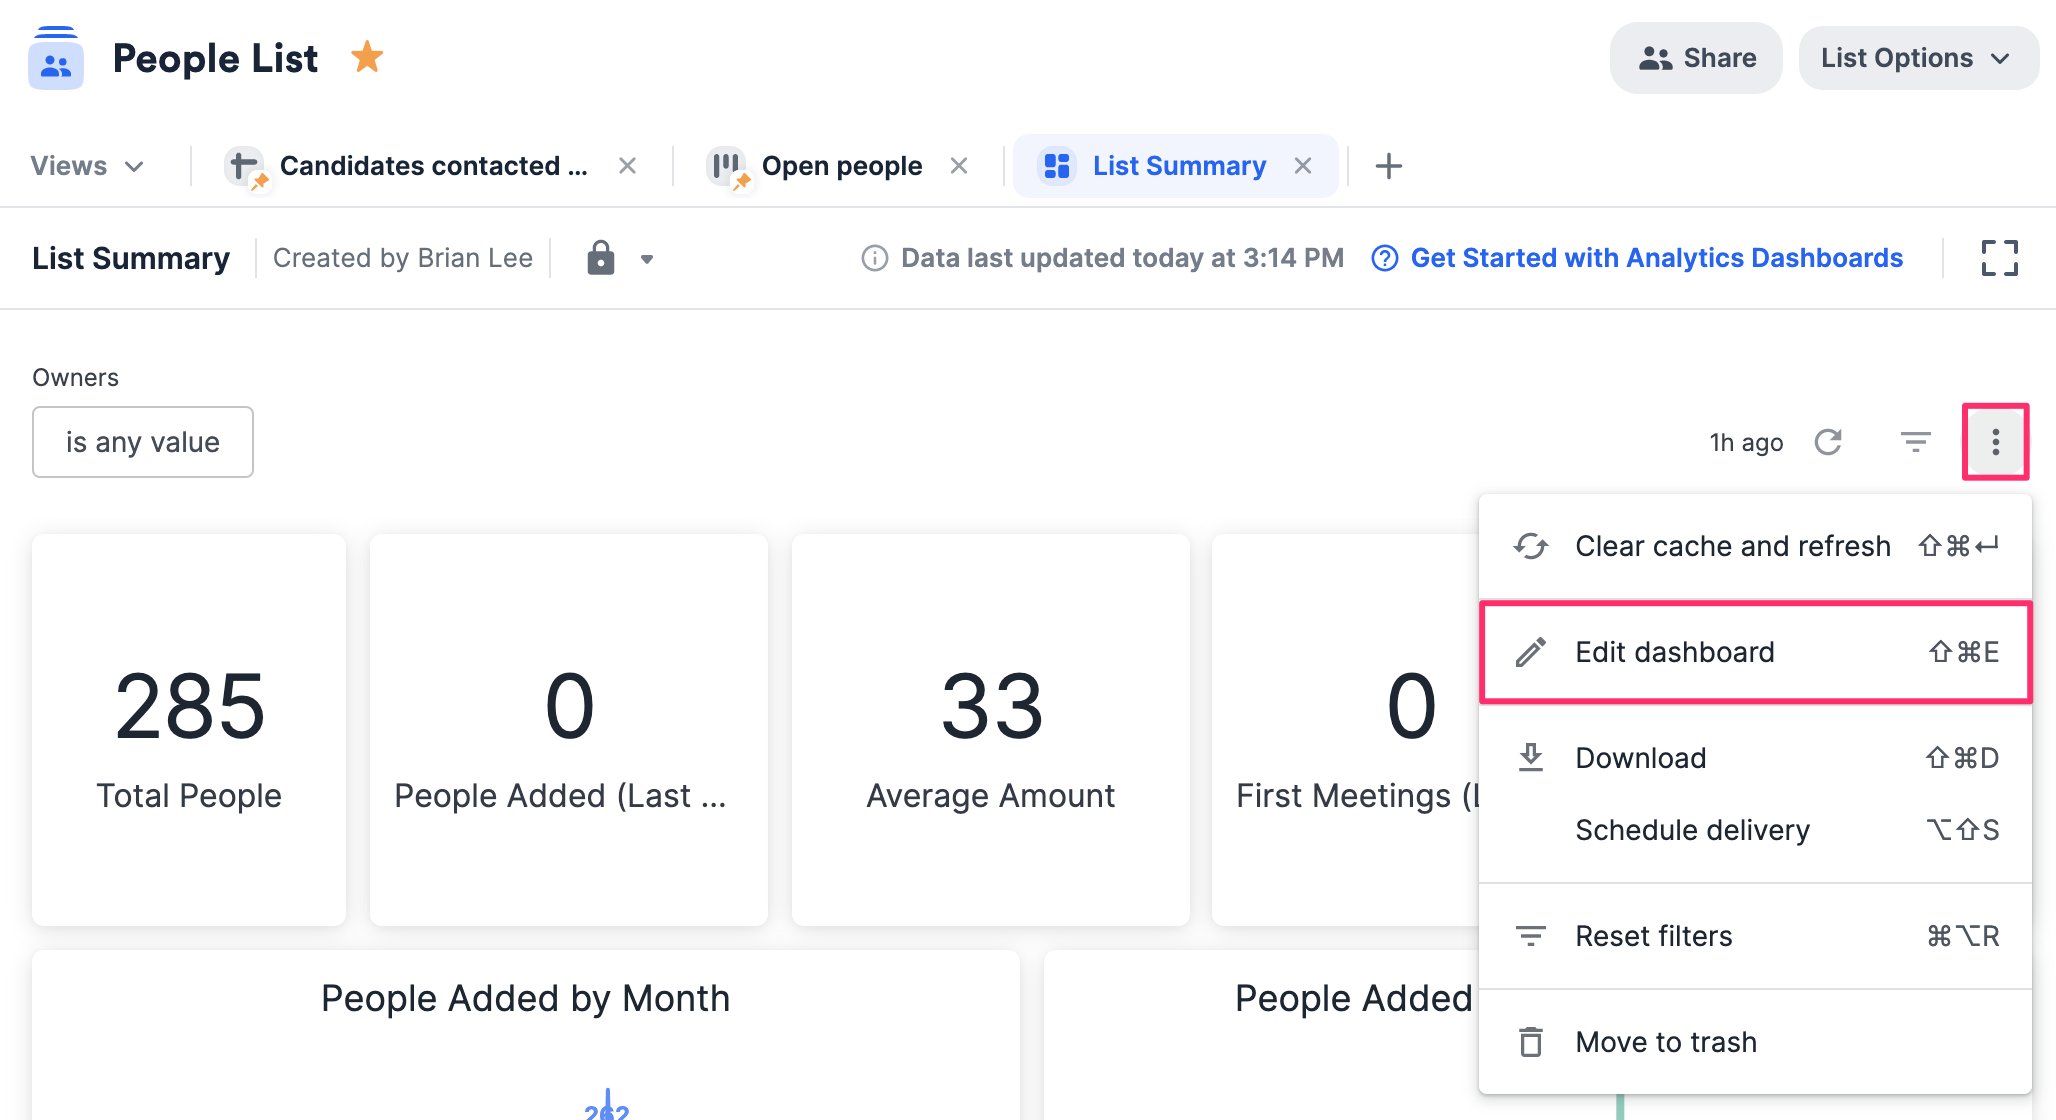
* Creators will see the **Edit dashboard** option when clicking on the **ellipsis (3 dotted icon)** in the top-right corner of a dashboard view, while Viewers will not.
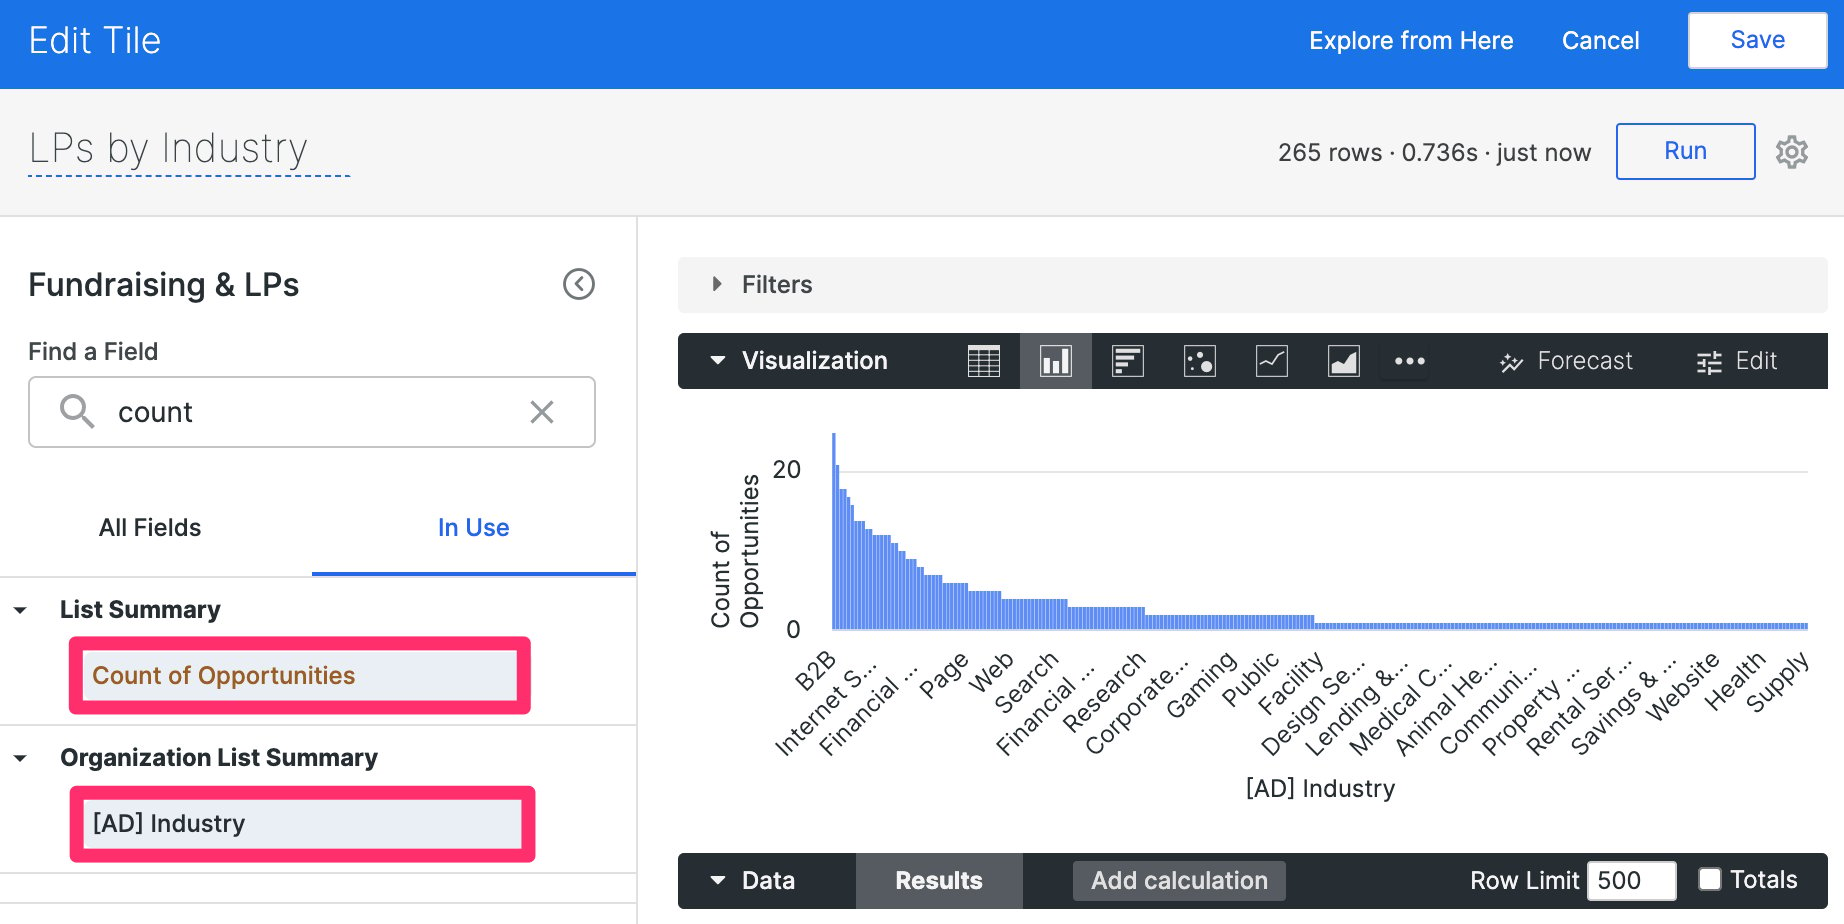
 **When it comes to creating reports in opportunity lists, are fields related to organizations also available?**
* Yes, organization-based [enriched and global fields](/s/article/Enriched-Global-and-List-specific-Fields) can be used in reports created within opportunity lists, check out the section "How to use organization-based fields in your reports for opportunity lists" in the article [Affinity Analytics - List Summary Reports](/s/article/Affinity-Analytics-List-Summary-Reports).
**When it comes to creating reports in opportunity lists, are fields related to organizations also available?**
* Yes, organization-based [enriched and global fields](/s/article/Enriched-Global-and-List-specific-Fields) can be used in reports created within opportunity lists, check out the section "How to use organization-based fields in your reports for opportunity lists" in the article [Affinity Analytics - List Summary Reports](/s/article/Affinity-Analytics-List-Summary-Reports).
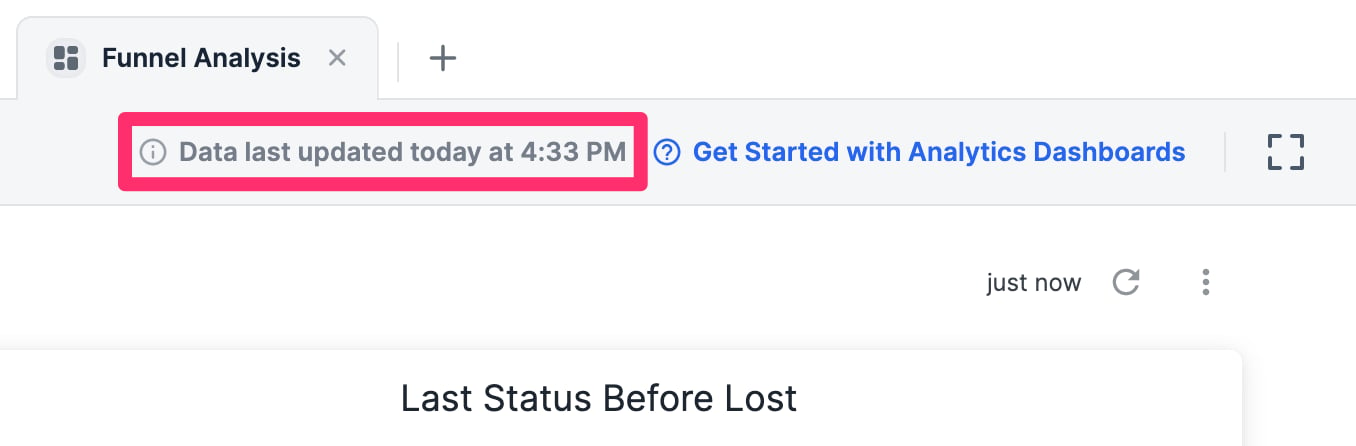
 **What is the time zone for the "Data last updated" timestamp in each dashboard view?**
* "Data last updated" is based on the time zone you set in your [Affinity Settings](/s/article/How-to-change-your-date-and-time-preferences).
**What is the time zone for the "Data last updated" timestamp in each dashboard view?**
* "Data last updated" is based on the time zone you set in your [Affinity Settings](/s/article/How-to-change-your-date-and-time-preferences).
 **Can I use Crunchbase data within Affinity Analytics?**
* Per our contract with Crunchbase, Crunchbase data **cannot** be used within Affinity Analytics.
* However, you can leverage our [Affinity Data](/s/article/Affinity-Data) fields instead.
**Why do I see NULL in some visualization tables?**
* NULL appears in some visualization tables when the fields being used are empty and do not have data.
* Simply add values to these fields for their respective list entries to reduce/eliminate the number of NULL values.
**Can I use Crunchbase data within Affinity Analytics?**
* Per our contract with Crunchbase, Crunchbase data **cannot** be used within Affinity Analytics.
* However, you can leverage our [Affinity Data](/s/article/Affinity-Data) fields instead.
**Why do I see NULL in some visualization tables?**
* NULL appears in some visualization tables when the fields being used are empty and do not have data.
* Simply add values to these fields for their respective list entries to reduce/eliminate the number of NULL values.
 * If they are meant to remain empty, you can also filter out the NULL values.
