> ## Documentation Index
> Fetch the complete documentation index at: https://support.affinity.co/llms.txt
> Use this file to discover all available pages before exploring further.
# Basic Reporting List Summary Reports
> Help center reference
**Reference** — lookup information.
List Summary Reports allow you to easily filter your data segmented by key fields such as: Status, Owner, Source, Industry, Owner & Status, Source & Status.
* Please note that Basic Reporting is a legacy feature that is no longer available for new customers.
* For those on the **Scale**, **Advanced**, and **Enterprise** tiers, you can leverage advanced reporting features with [Affinity Analytics](/s/article/Getting-started-with-Affinity-Analytics).
* For those on the **Essential** tier, we highly suggest upgrading to the **Scale**, **Advanced**, or **Enterprise** tiers to leverage Affinity Analytics.
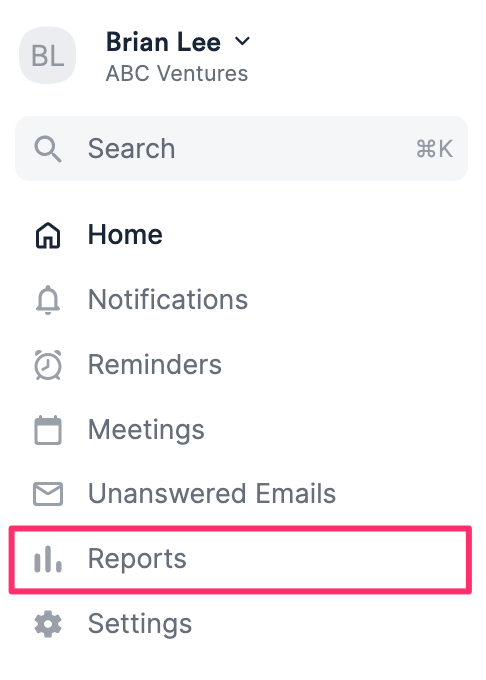
1. Click the **Reports** tab on your global navigation bar.
 2. Begin by **selecting a list** and specifying the time period in **Date Added**.
3. Use a saved view from the list to quickly apply its associated filters, or click the **Filter** icon to start from scratch.
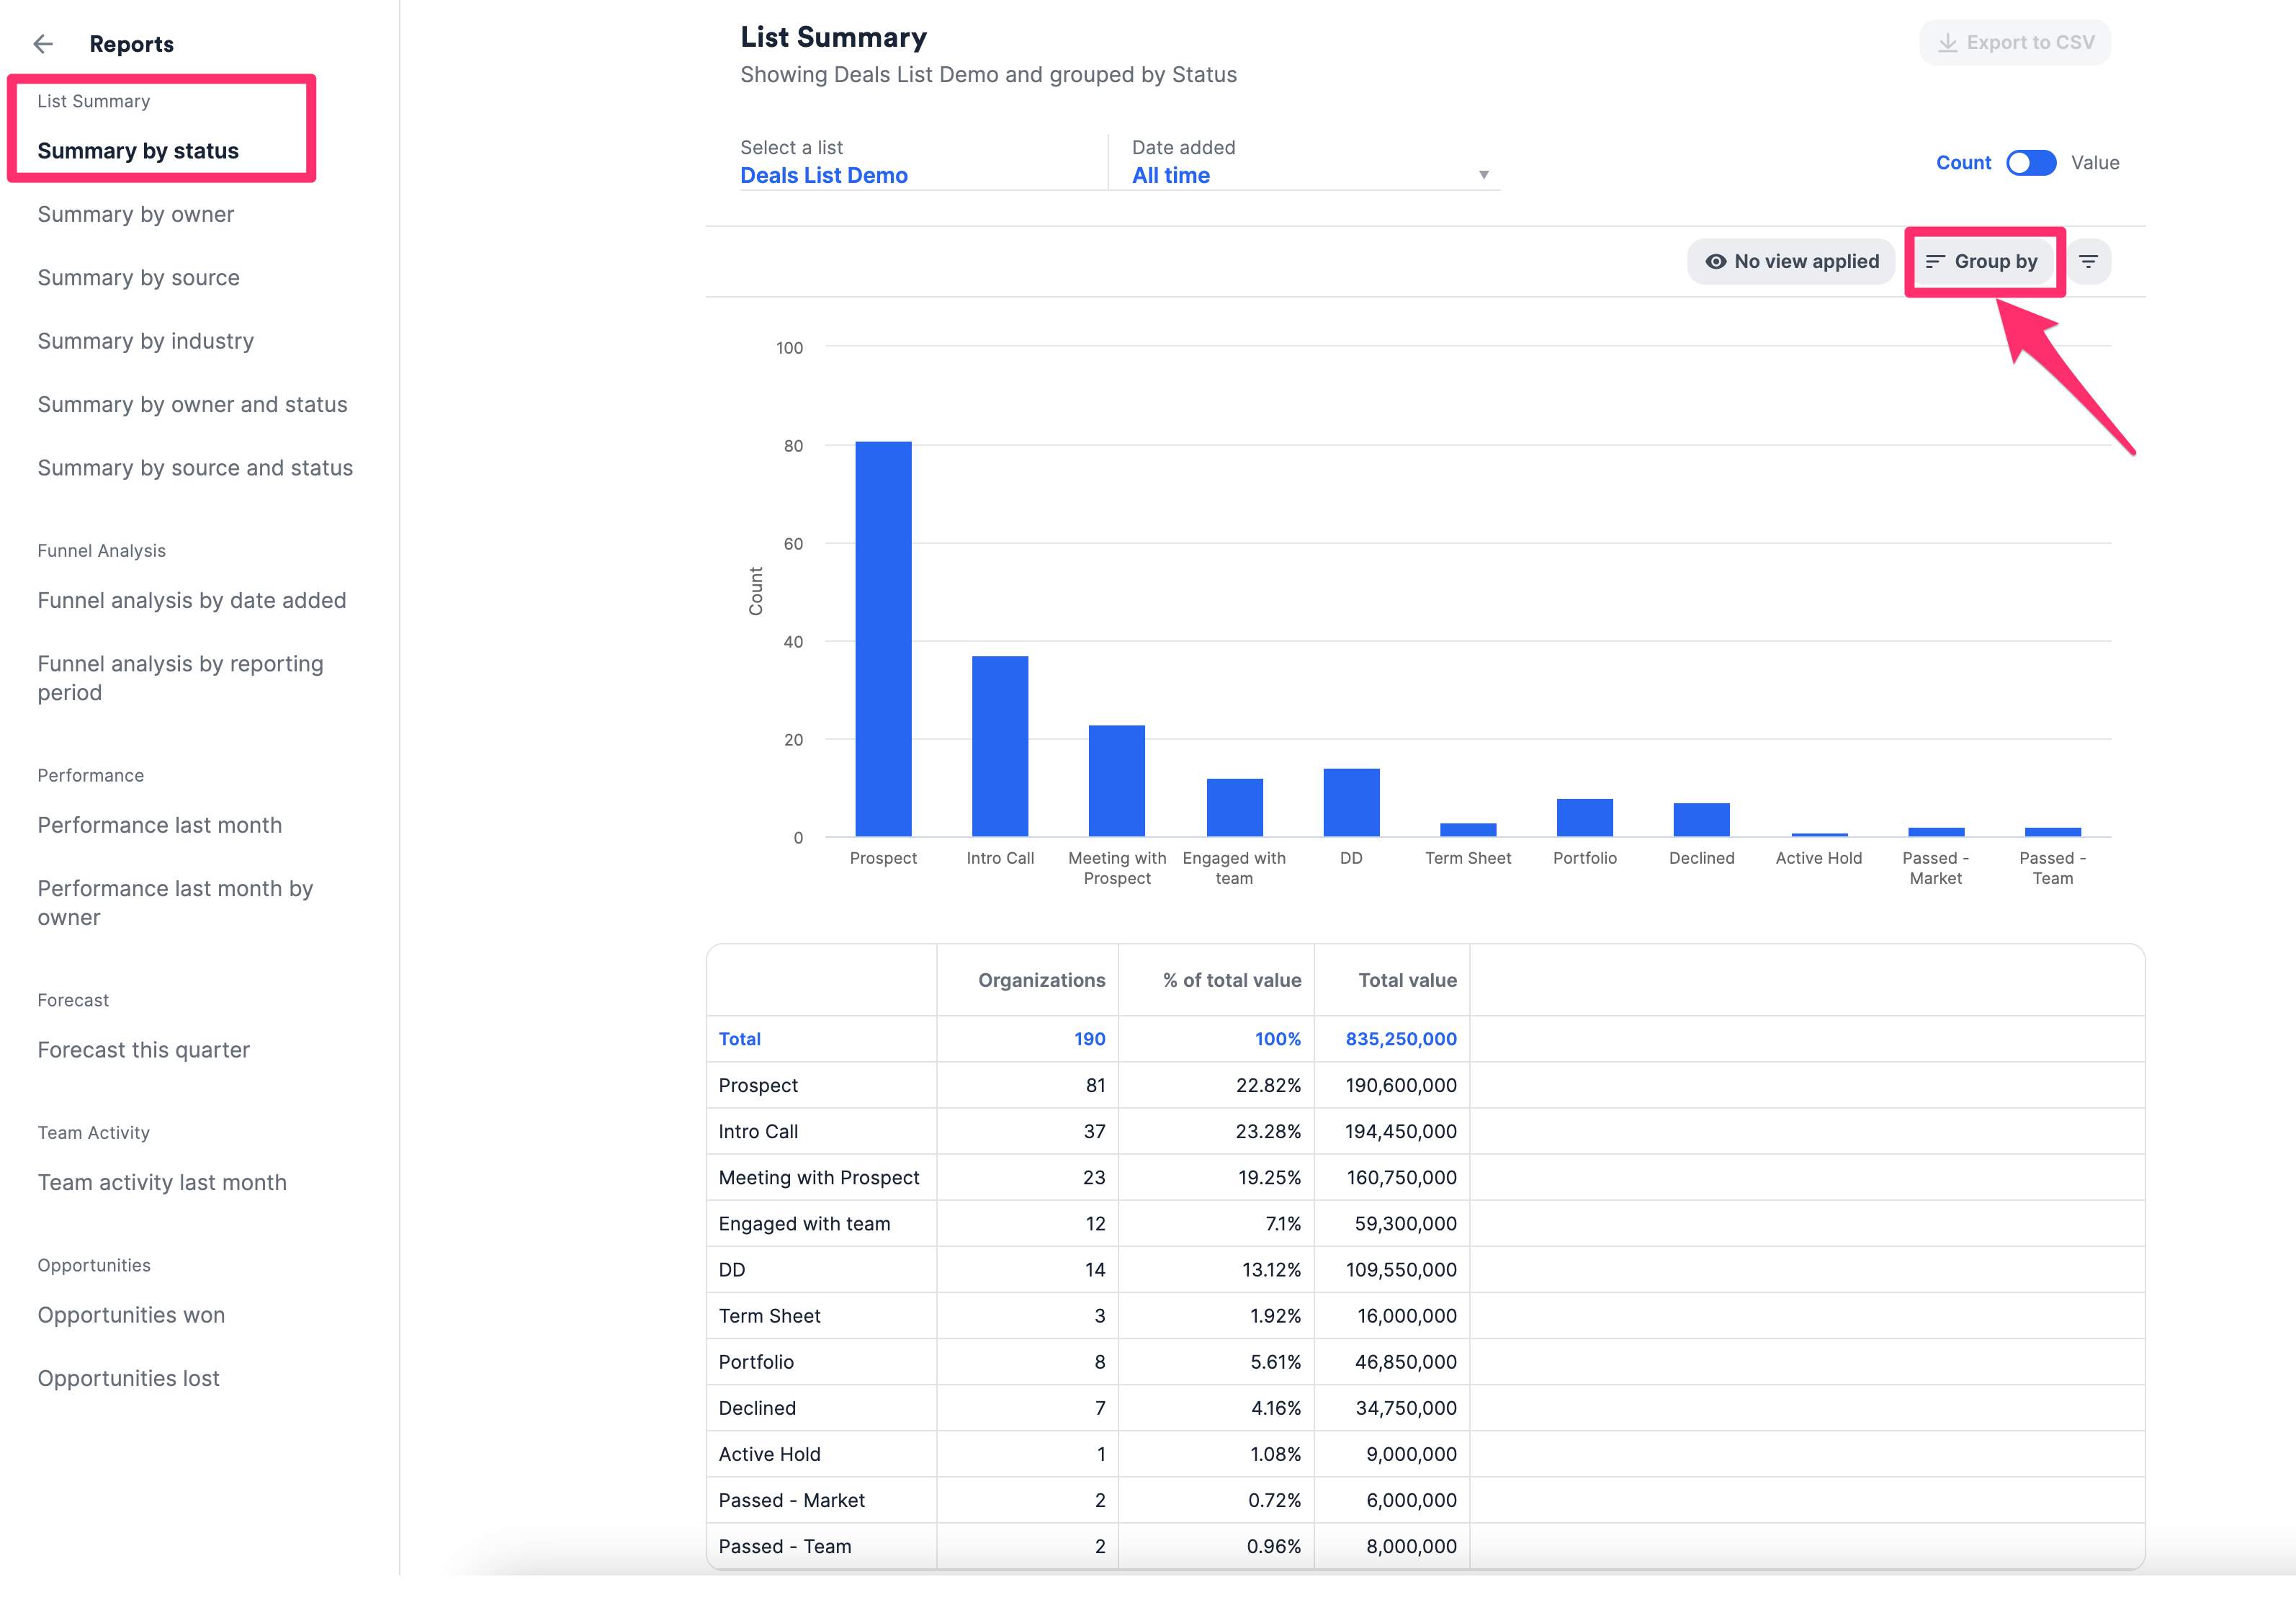
4. All the tabs on the left are simply pre-applied templates (i.e. Summary by status, Summary by owner, etc.). Click **Group by** to override the template and change the groupings in the x-axis.
2. Begin by **selecting a list** and specifying the time period in **Date Added**.
3. Use a saved view from the list to quickly apply its associated filters, or click the **Filter** icon to start from scratch.
4. All the tabs on the left are simply pre-applied templates (i.e. Summary by status, Summary by owner, etc.). Click **Group by** to override the template and change the groupings in the x-axis.
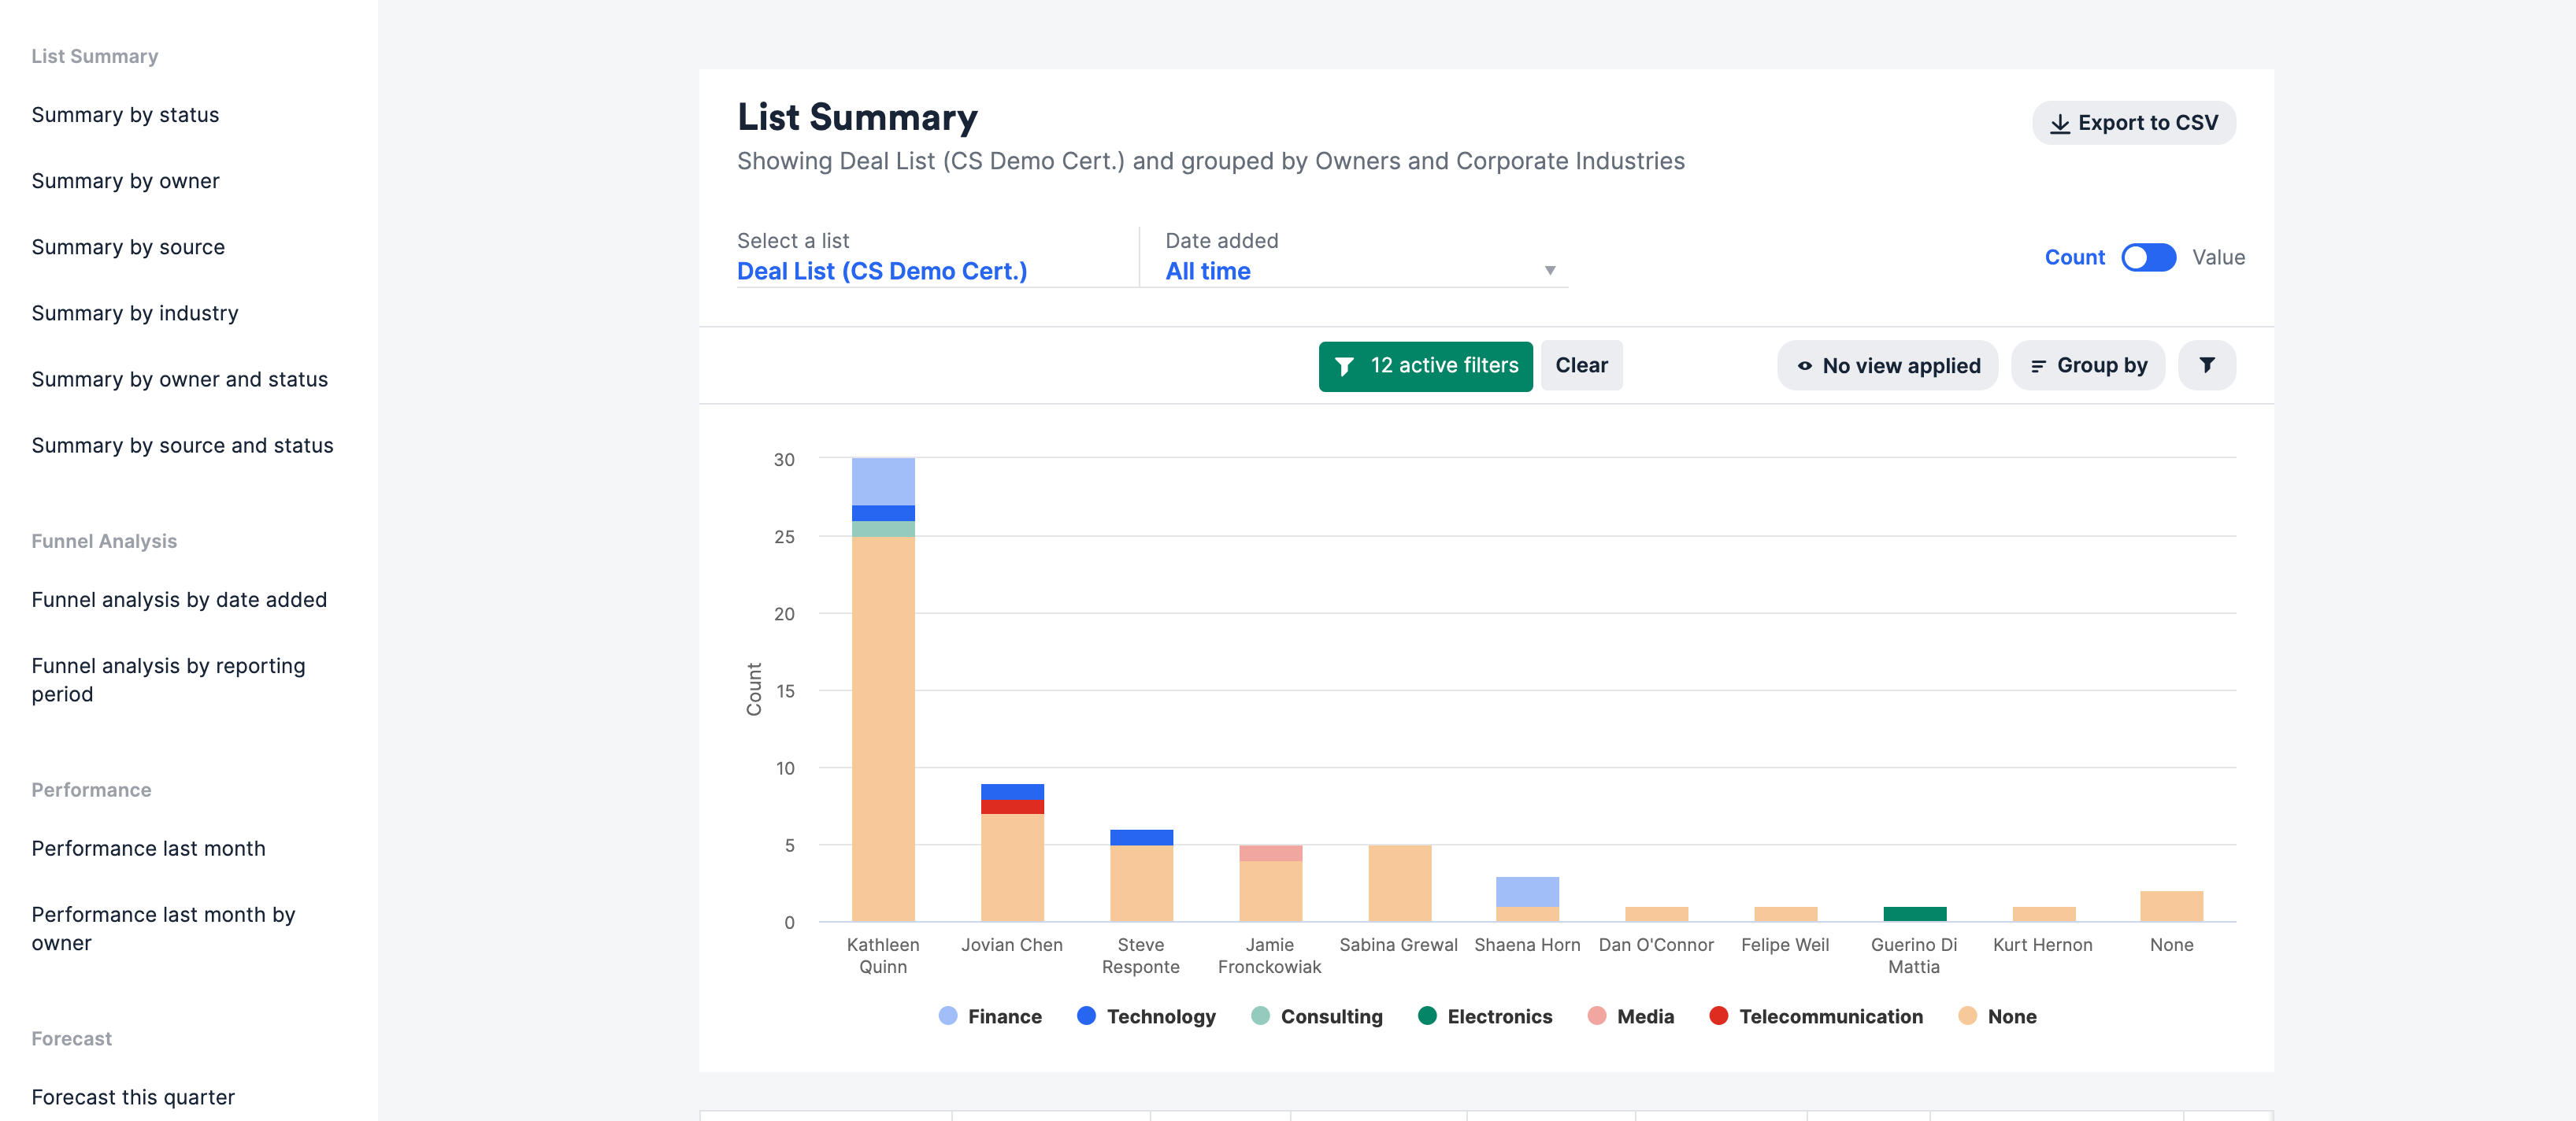
 5. You can have up to two different groupings. The 1st field will be displayed on the x-axis and the 2nd field is color-coded by each bar along the y-axis. In the example below, the list is grouped by Owners first, then by Industry within each owner.