> ## Documentation Index
> Fetch the complete documentation index at: https://support.affinity.co/llms.txt
> Use this file to discover all available pages before exploring further.
# Basic Reporting Forecast Reports
> Help center reference
**Reference** — lookup information.
Forecast into the future to see how many deals you expect to close over any date range, based on the status for each deal.
* Please note that Basic Reporting is a legacy feature that is no longer available for new customers.
* For those on the **Scale**, **Advanced**, and **Enterprise** tiers, you can leverage advanced reporting features with [Affinity Analytics](/s/article/Getting-started-with-Affinity-Analytics).
* For those on the **Essential** tier, we highly suggest upgrading to the **Scale**, **Advanced**, or **Enterprise** tiers to leverage Affinity Analytics.
### Example
1. Please note, you can only generate forecast reports using **opportunity-type lists**, not people-type or organization-type lists.
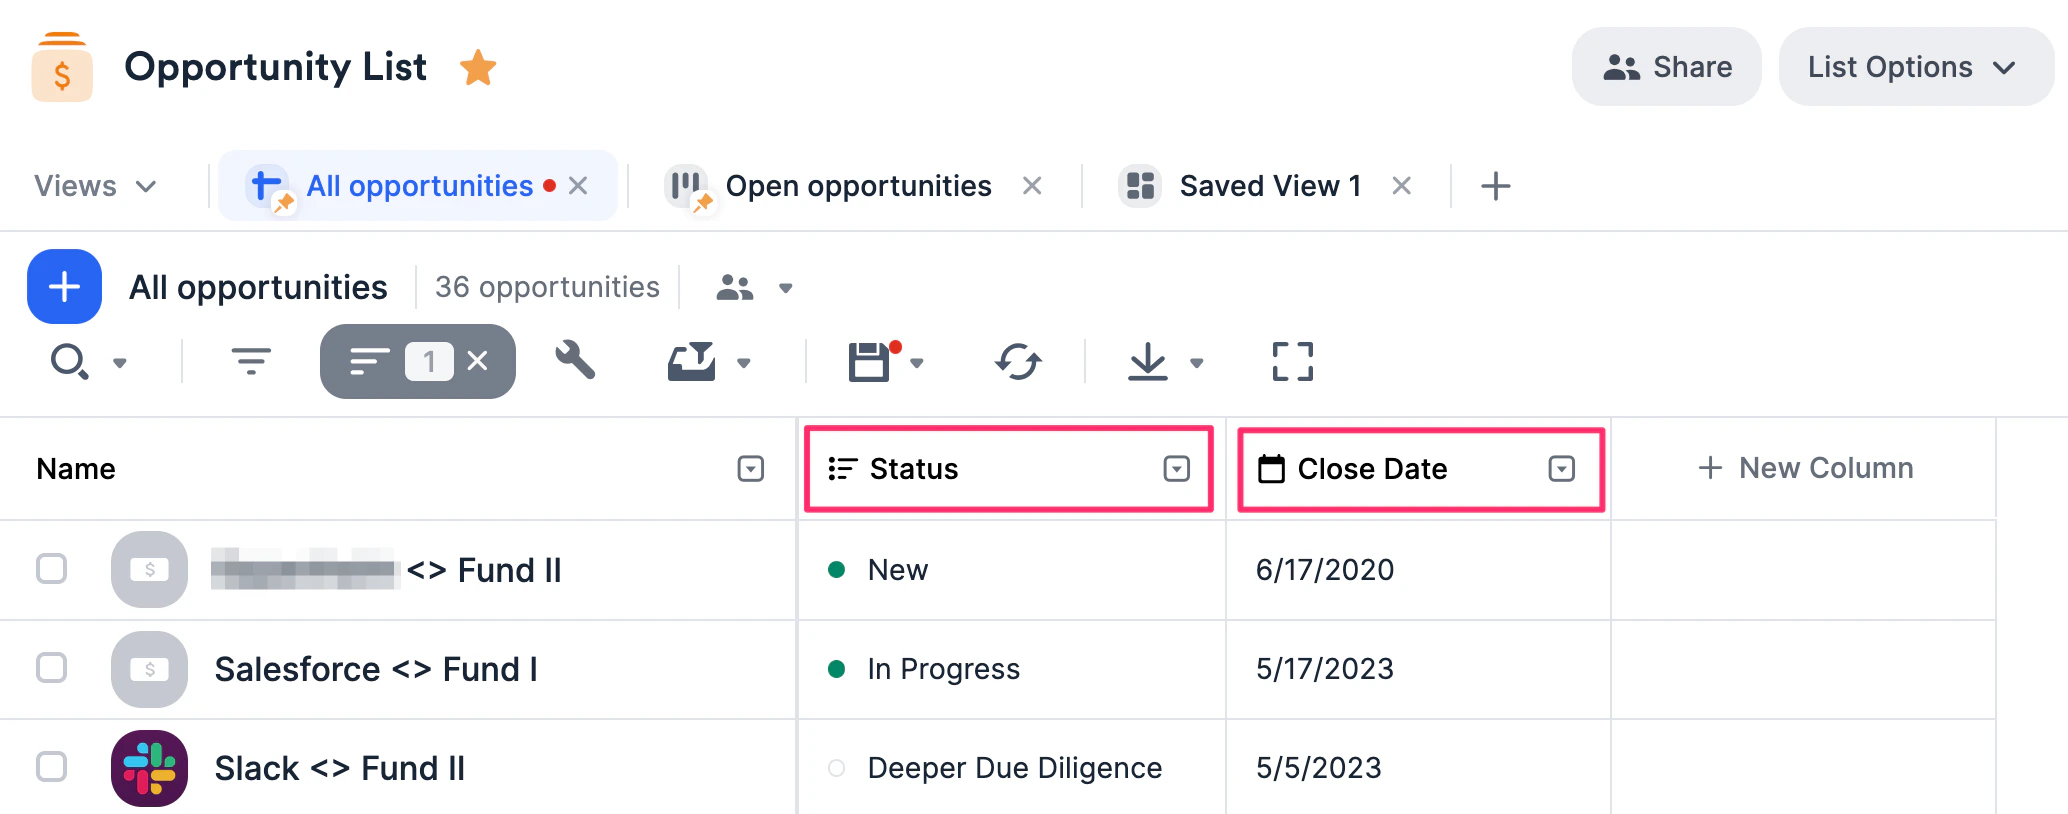
2. Make sure you have both the default **Status** and **Close Date** columns filled out to successfully generate a Forecast Report.
**Note**: The ability to assign and edit the win probabilities for the **Status** column are only available in opportunity-type lists.
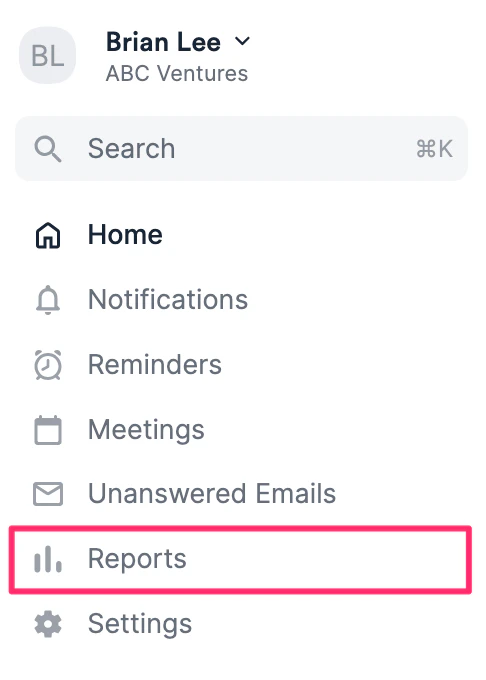
 3. Then, click the **Reports** tab on your global navigation bar.
 4. Select **Forecast this quarter**.
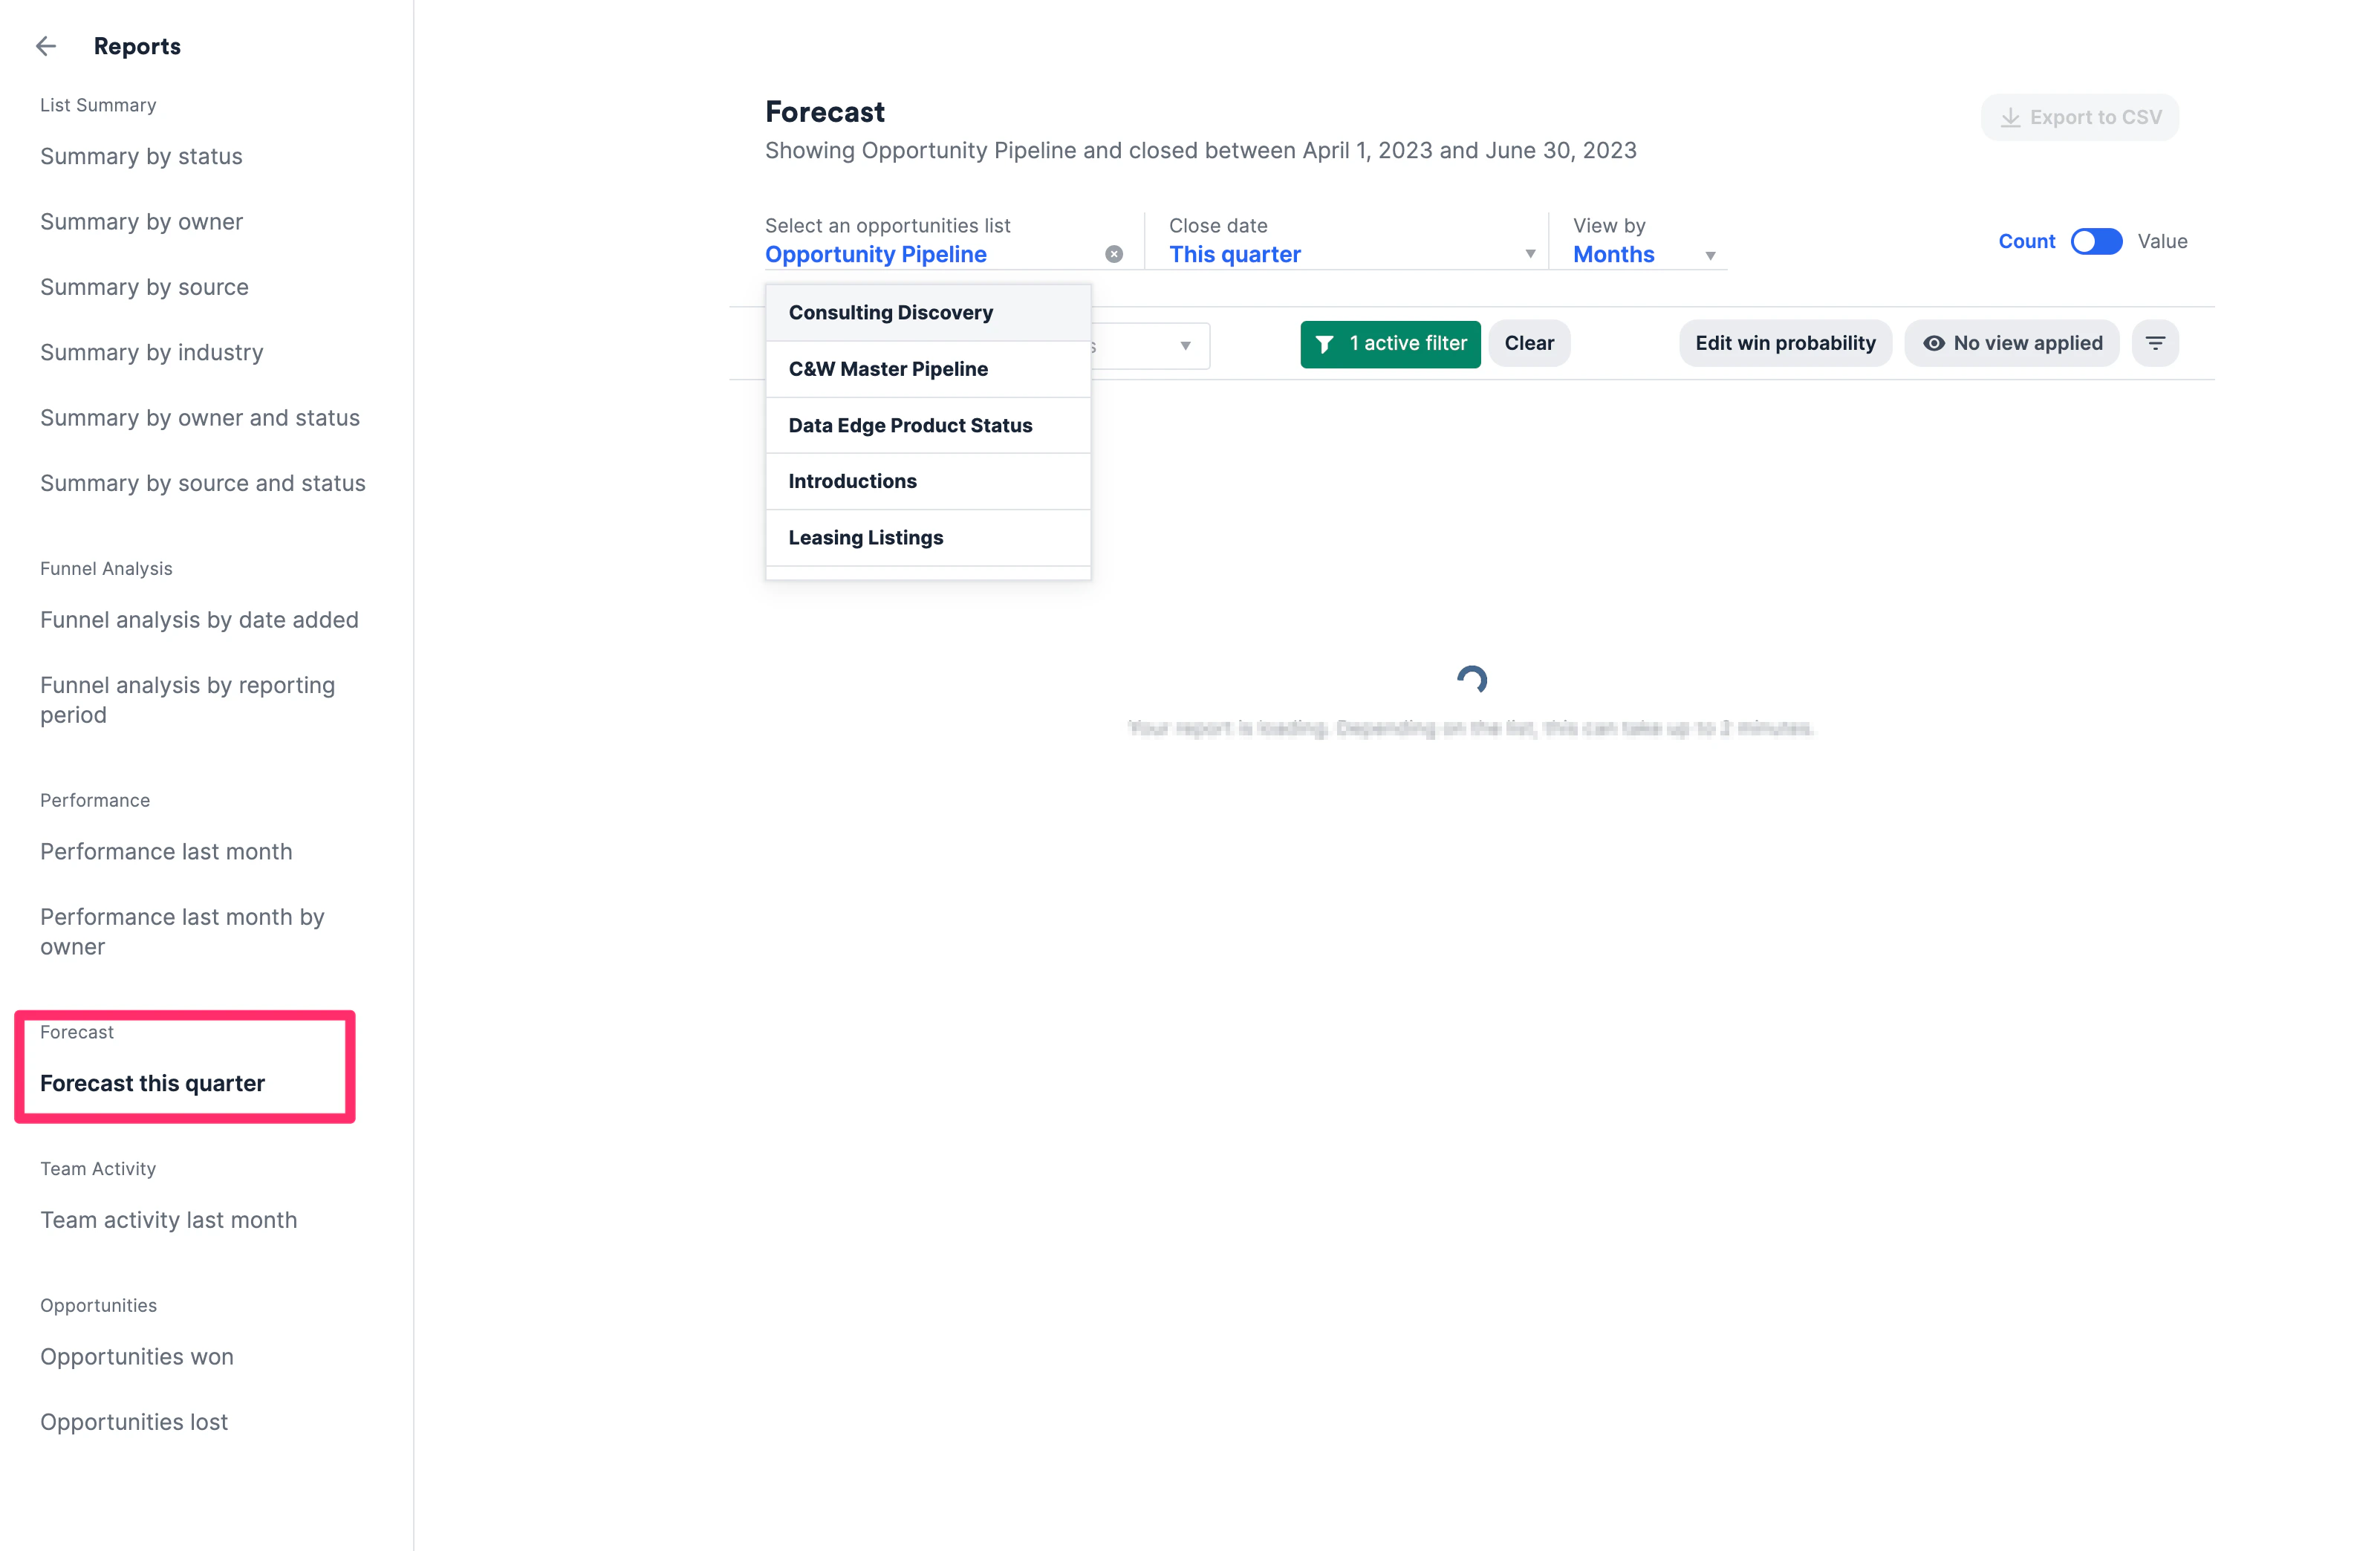 5. Select an **opportunity-type list** and specify a period of time for the **Close date** to view the Forecast report.
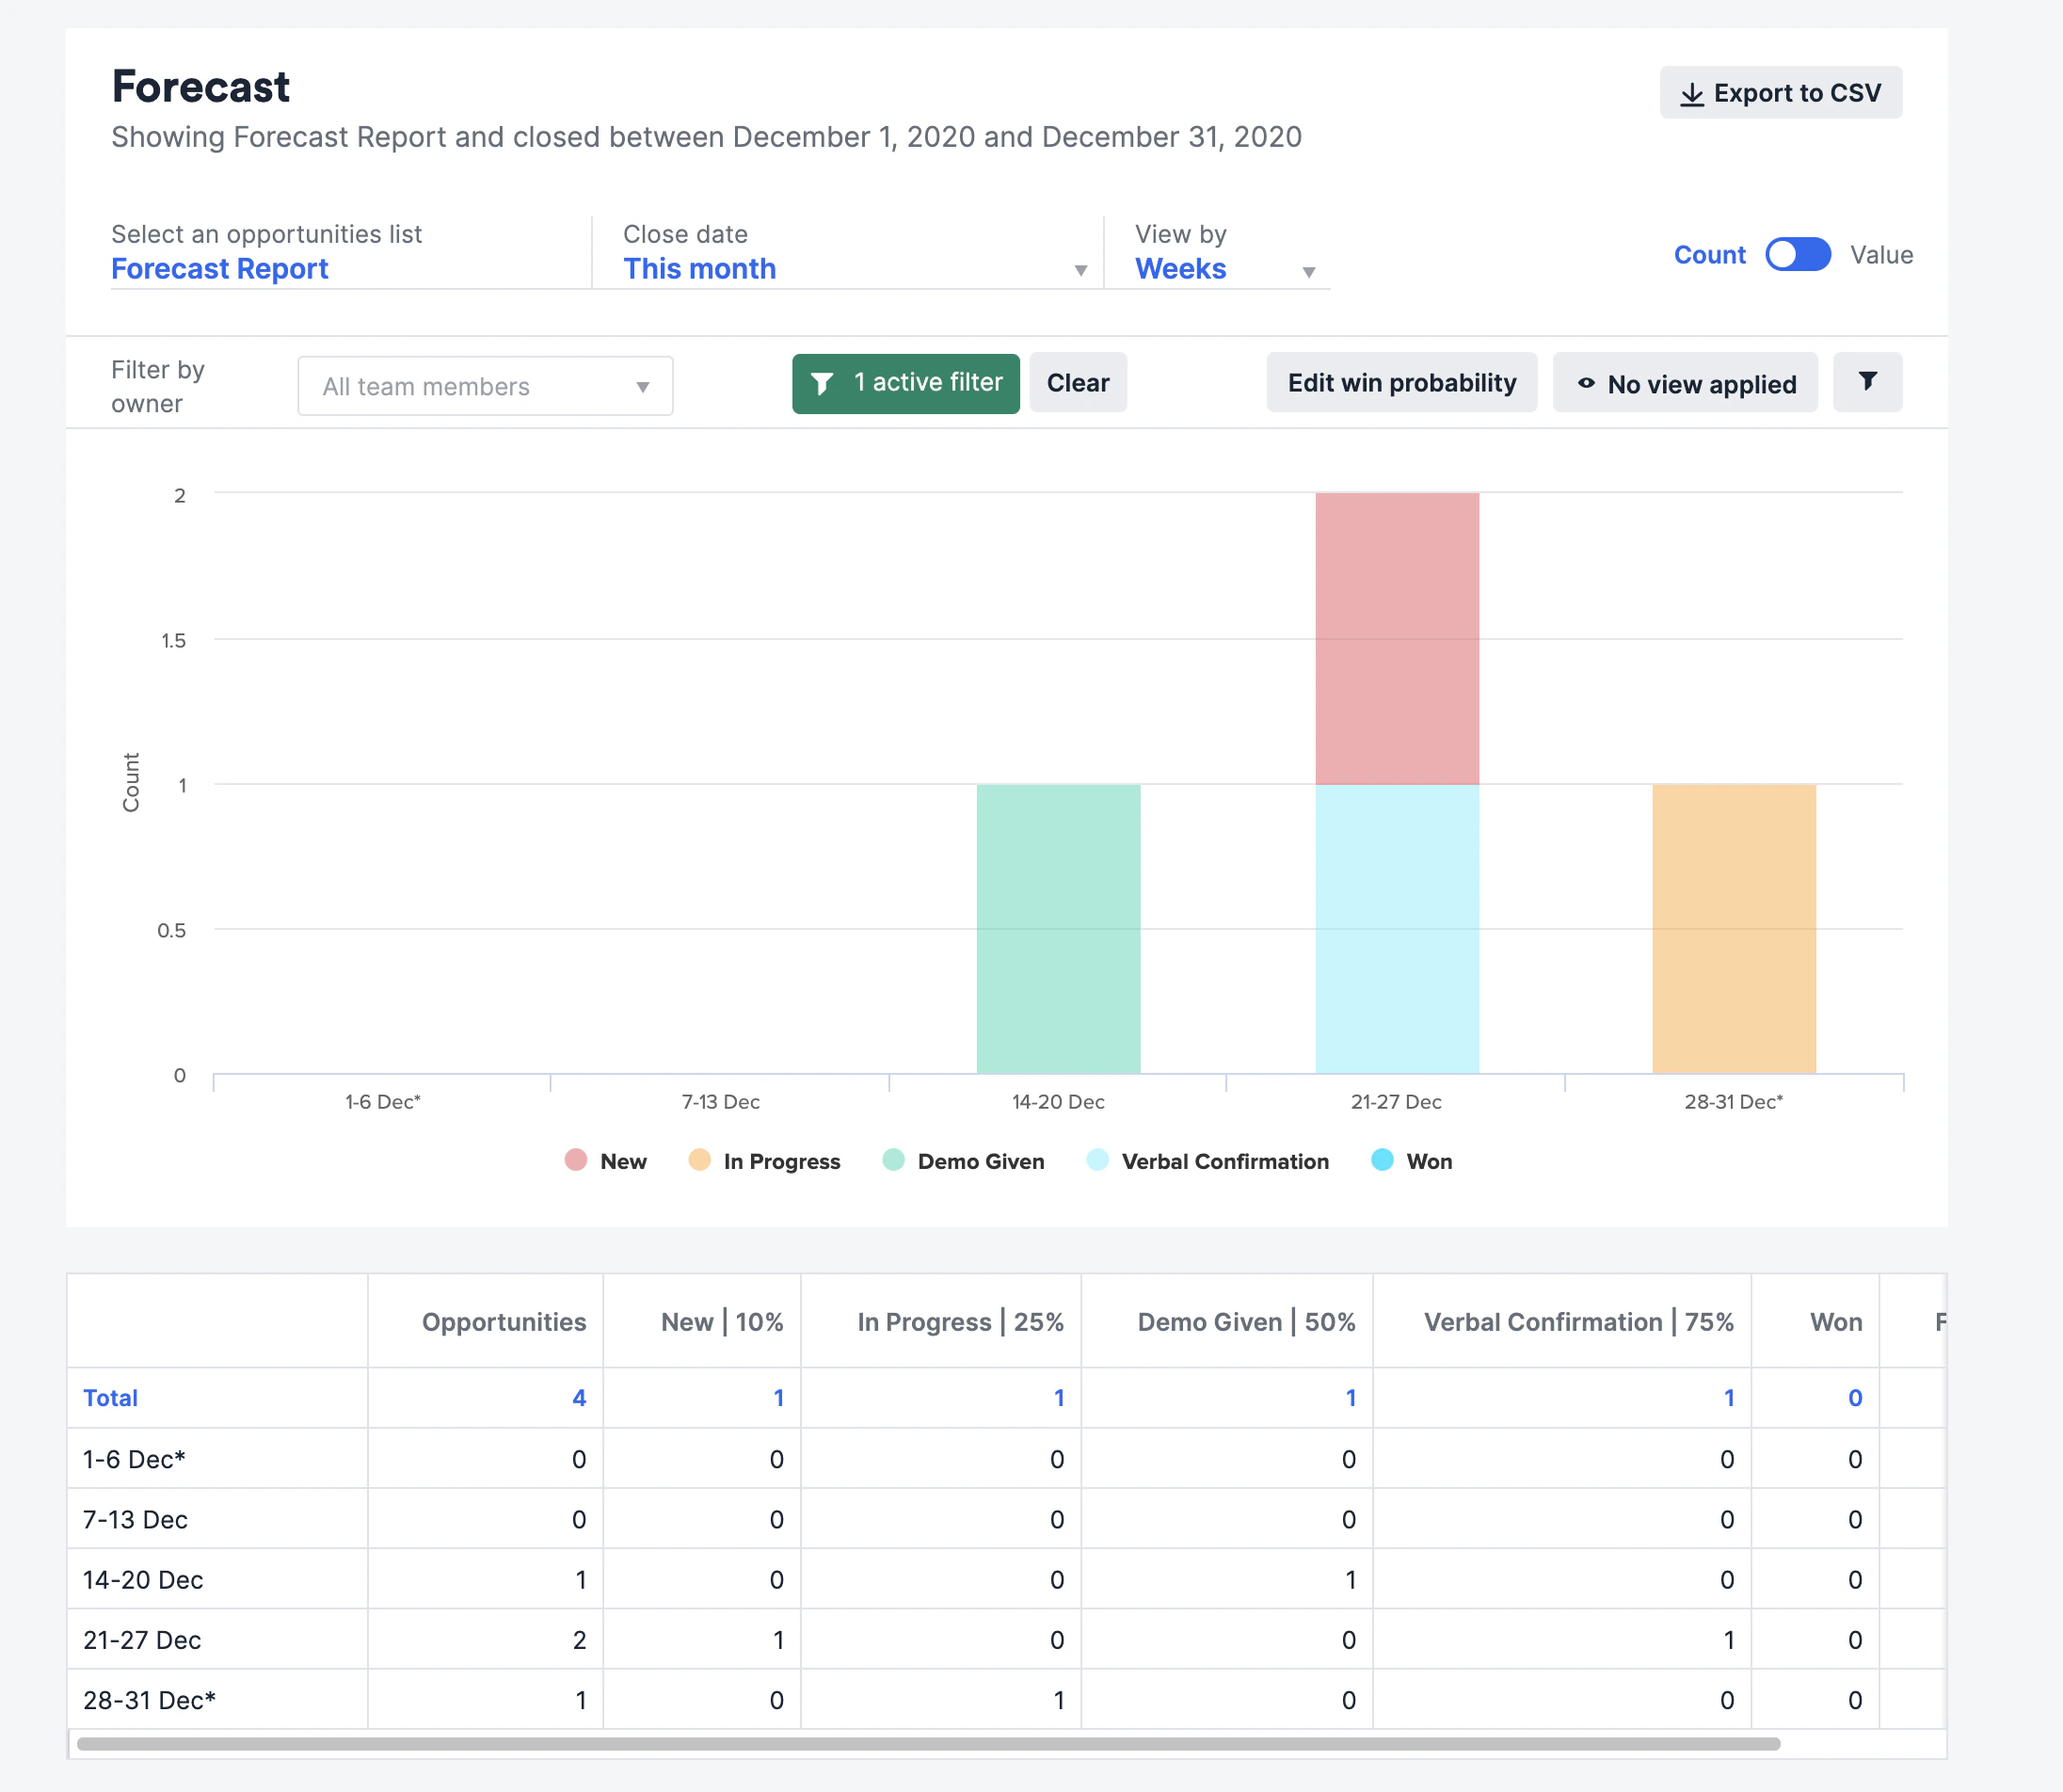 ### How probabilities are calculated into the Forecast Report
* Expected Revenue = win probability \* amount
* The win probability will range from 0 to 1.
* The win probability of Won statuses is always 1.
* **Example**: Imagine there's a 50% chance for deals in the "Due Diligence" status to close.
* If you have 2 deals in that status (Deal #1 is going for \$100k while Deal #2 is going for \$50k), your estimated revenue next month would be \$75k.
### How probabilities are calculated into the Forecast Report
* Expected Revenue = win probability \* amount
* The win probability will range from 0 to 1.
* The win probability of Won statuses is always 1.
* **Example**: Imagine there's a 50% chance for deals in the "Due Diligence" status to close.
* If you have 2 deals in that status (Deal #1 is going for \$100k while Deal #2 is going for \$50k), your estimated revenue next month would be \$75k.