> ## Documentation Index
> Fetch the complete documentation index at: https://support.affinity.co/llms.txt
> Use this file to discover all available pages before exploring further.
# Affinity Analytics Introductions Summary Reports
> Help center reference
**Reference** — lookup information.
Quantify success, showcase the value of your network, and drive lasting LP/founder relationships with the new **Introductions Summary Report** in Affinity Analytics.
## Definitions to know before getting started
Here are some helpful terms to know as they'll be used in the **Introductions Summary Report**:
1. **Introducer** - The person who is introducing the **Target Person** to the **Introducee**.
2. **Target Person** - The person who is being introduced to the **Introducee**.
3. **Introducee** - The person who is being introduced to the **Target Person**.
* By looking at the "To" and "CC" lines of an introduction email, Affinity determines who might be the **Target Person** and who might be the **Introducee**.
* While the "To" line is used to identify the **Target Person** in most cases, there may be some edge cases where the "CC" line is used instead.
## How to create an Introduction Summary Report using the template
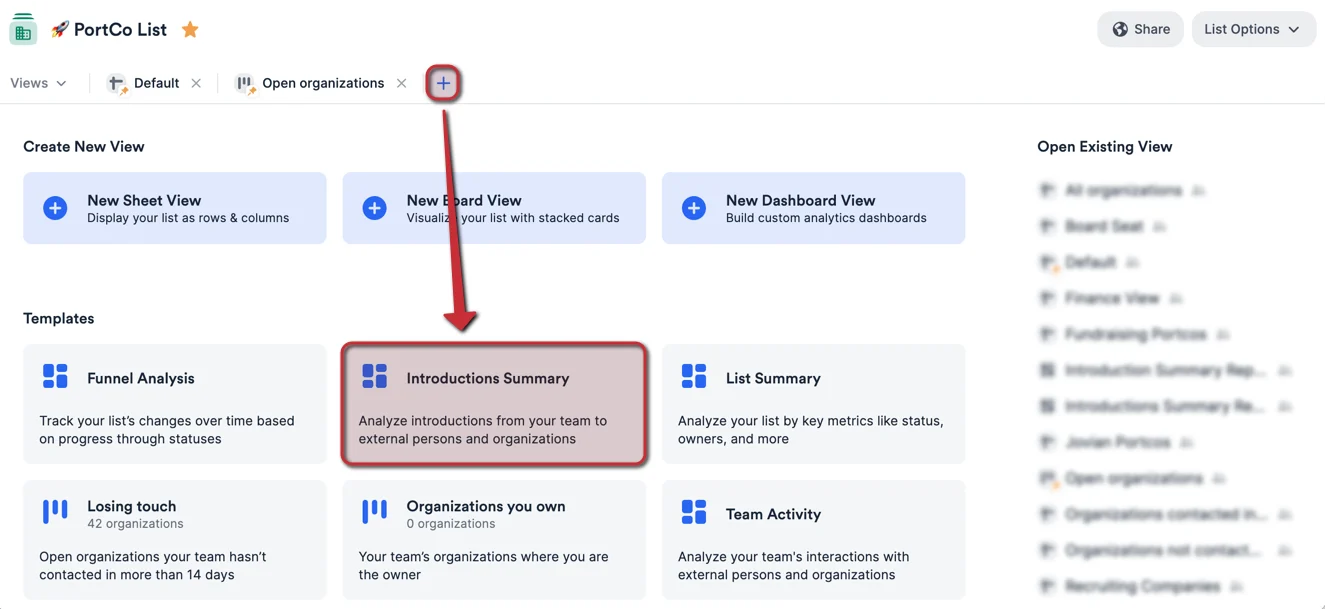
1. First, click into the list you'd like to report on, then click the **+** icon as shown below. Then, click the **Introductions Summary** template option to create a new dashboard view.
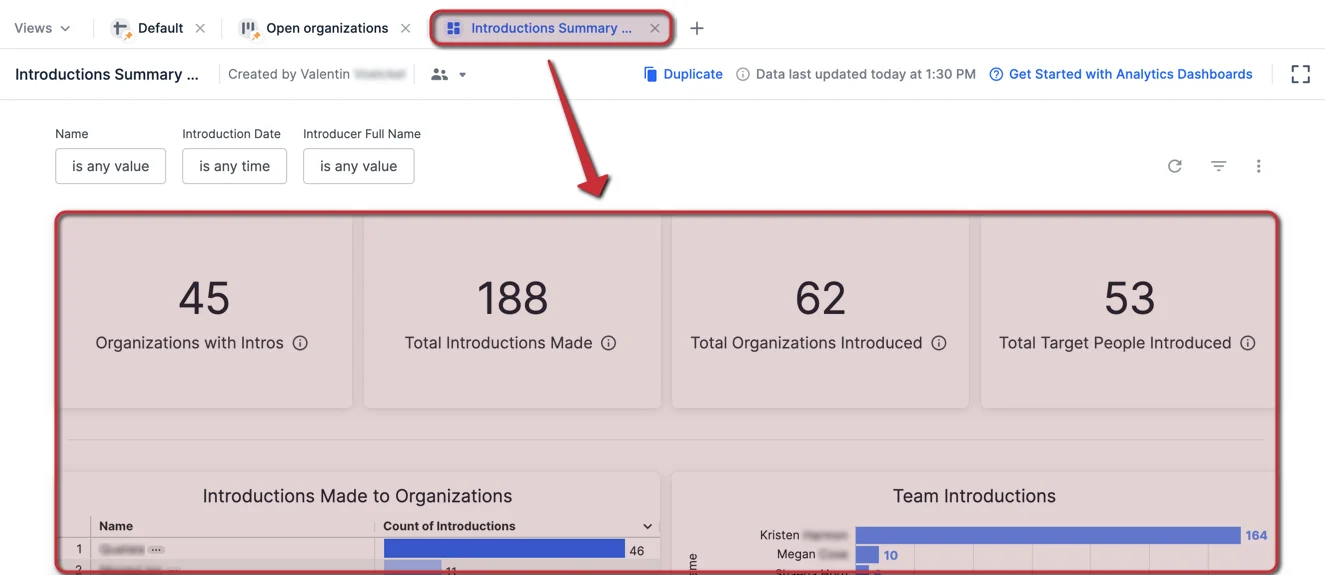
 2. Once the **Introductions Summary** report is generated, you will immediately see different visualization tiles and metrics based on the data within this list.
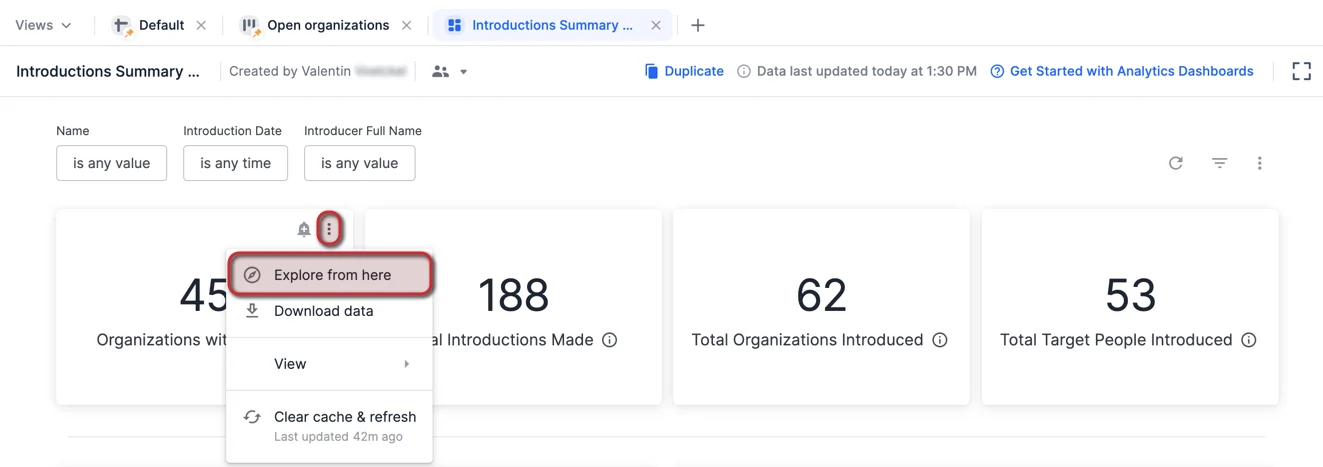
 3. Want to understand how certain visualization tiles were generated? Click the ellipsis (3-dotted icon) on the top-right corner of the visualization tile you want to dig deeper into, then click **Explore from here**.
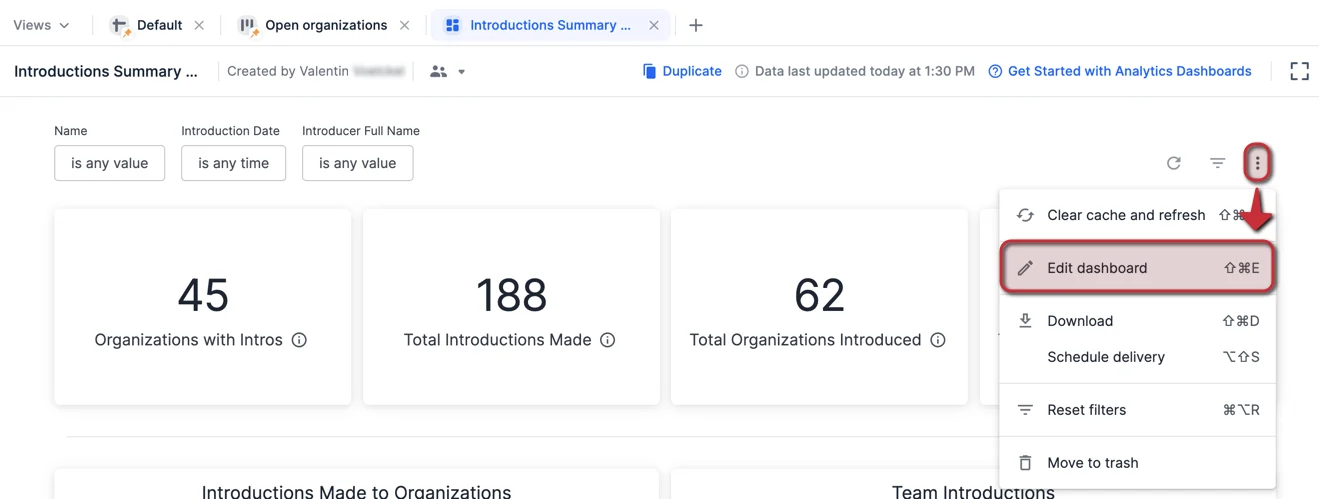
 4. If you'd like to change the data fields being used for certain visualization tiles, click the ellipsis (3-dotted icon) on the top-right corner, then click **Edit dashboard**.
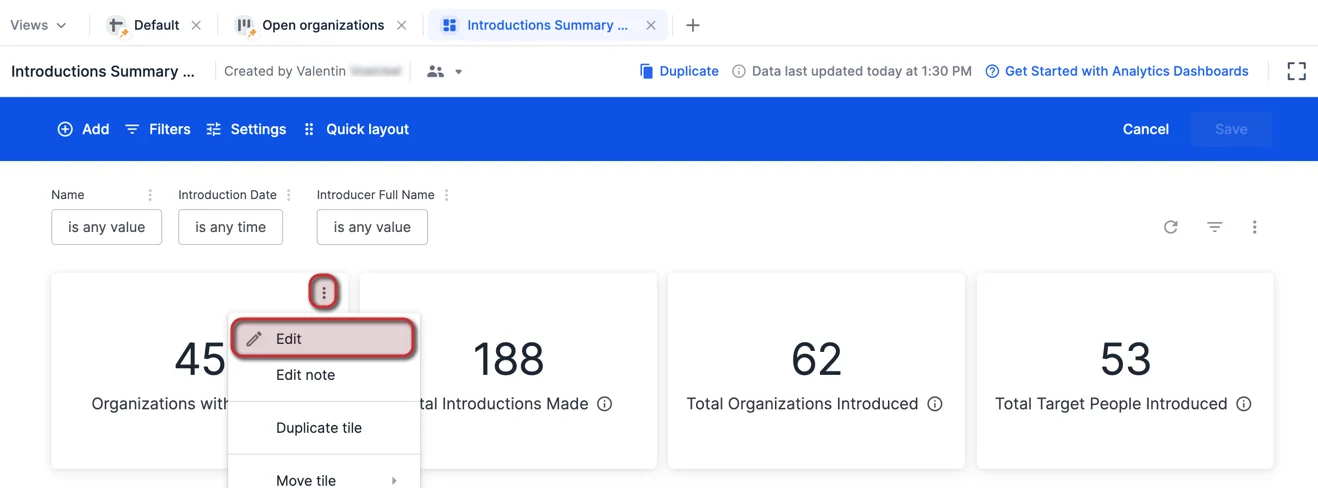
 5. Then, click the ellipsis (3-dotted icon) on the top-right corner of the visualization tile you want to dig deeper into, then click **Edit**.
 6. To learn more about customizing, filtering, and pivoting data on your dashboard view, check out the following articles to take your skills to the next level:
* [How to create a dashboard view](/s/article/How-to-create-a-dashboard-view)
* [How to create custom groups in dashboard views](/s/article/How-to-create-custom-groups-in-dashboard-views)
* [How to apply filters in dashboard views](/s/article/How-to-apply-filters-in-dashboard-views)
* [How to pivot data on your dashboard views](/s/article/How-to-pivot-data-on-your-dashboard-views)
## What is the method used to count these introductions?
1. Affinity is looking at the introductions made by you/your team members to external people/organizations you communicate with. These introductions will be identified and stored in the **Introductions** tab found on the organizations' profile pages.
6. To learn more about customizing, filtering, and pivoting data on your dashboard view, check out the following articles to take your skills to the next level:
* [How to create a dashboard view](/s/article/How-to-create-a-dashboard-view)
* [How to create custom groups in dashboard views](/s/article/How-to-create-custom-groups-in-dashboard-views)
* [How to apply filters in dashboard views](/s/article/How-to-apply-filters-in-dashboard-views)
* [How to pivot data on your dashboard views](/s/article/How-to-pivot-data-on-your-dashboard-views)
## What is the method used to count these introductions?
1. Affinity is looking at the introductions made by you/your team members to external people/organizations you communicate with. These introductions will be identified and stored in the **Introductions** tab found on the organizations' profile pages.
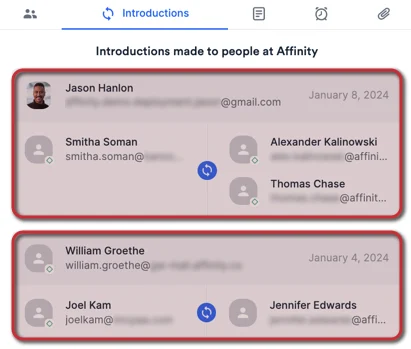
 2. Please note that each box shows one email interaction that Affinity considers to be an introduction, see the section titled "**How does Affinity determine if an interaction is an introduction?**" in [How to track introductions in Affinity](/s/article/How-to-track-introductions-in-Affinity). Each box is counted as **one** introduction, even if there are multiple people being introduced to each other within that email interaction. In this example below, it will count as **2 Total Introductions Made**.
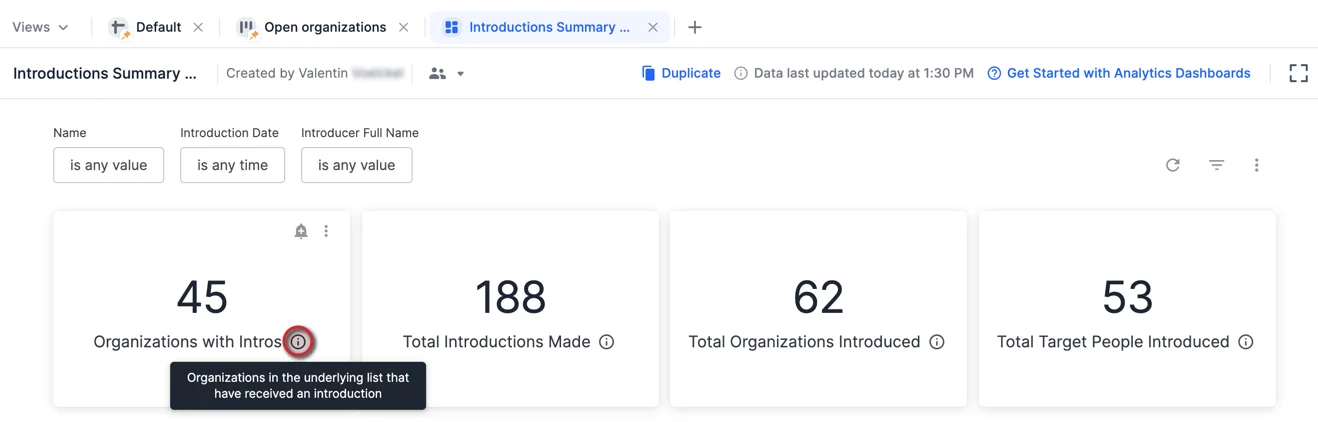
 3. Hover over the **Information** icon for each card to learn more.
 ## How do I only count introductions between externals (outside of my organization)?
By default, these **Introduction** cards will include introduction counts using the two following methods:
1. Method 1 - Introductions between **you/your fellow team members** and **external contacts** at your portfolio company.
2. Method 2 - Introductions between **external people (outside your organization)** and **external contacts** at your portfolio company.
**Create a filter to only count introductions between externals**
1. In this example, let's say your company is *Affinity* and your portfolio company is *Morgan Stanley*.
2. You will have to create a new filter for the **Intro Target People Company Name**. Start by clicking the ellipsis (3-dotted icon) and click **Edit**.
3. Then, click **Filters** and click **Add Filter**.
## How do I only count introductions between externals (outside of my organization)?
By default, these **Introduction** cards will include introduction counts using the two following methods:
1. Method 1 - Introductions between **you/your fellow team members** and **external contacts** at your portfolio company.
2. Method 2 - Introductions between **external people (outside your organization)** and **external contacts** at your portfolio company.
**Create a filter to only count introductions between externals**
1. In this example, let's say your company is *Affinity* and your portfolio company is *Morgan Stanley*.
2. You will have to create a new filter for the **Intro Target People Company Name**. Start by clicking the ellipsis (3-dotted icon) and click **Edit**.
3. Then, click **Filters** and click **Add Filter**.
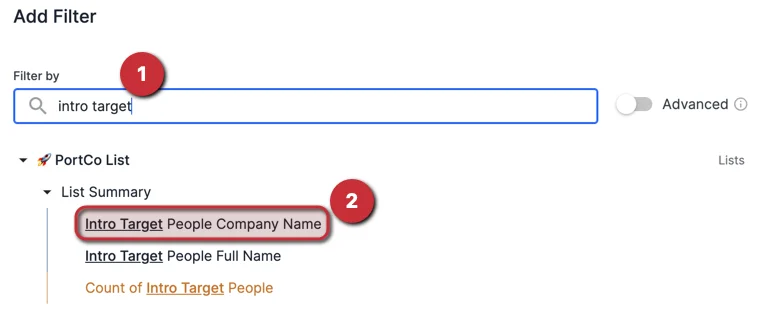
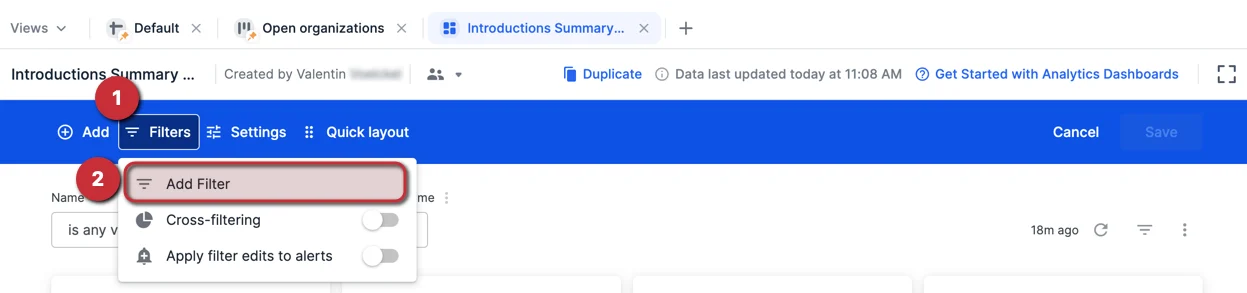 4. Type in "intro target" and select the dimension: **Intro Target People Company Name**
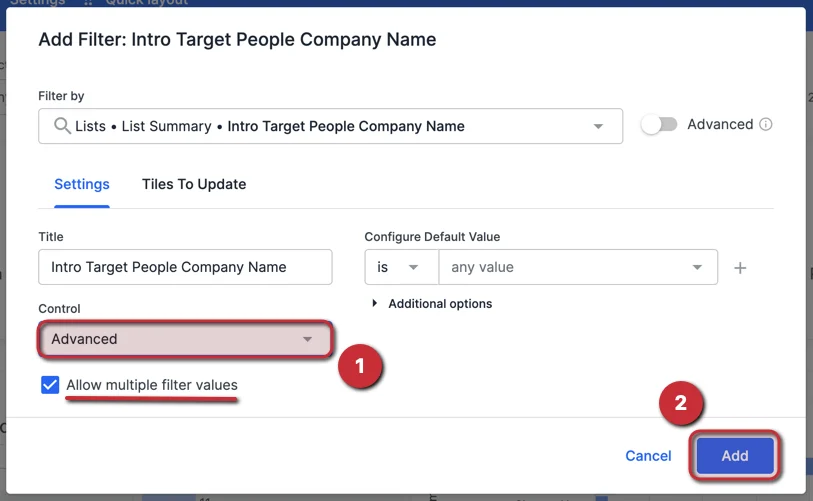
 5. Change the **Control** option to **Advanced**, make sure to check the box to **Allow multiple filter values**, then click **Add**.
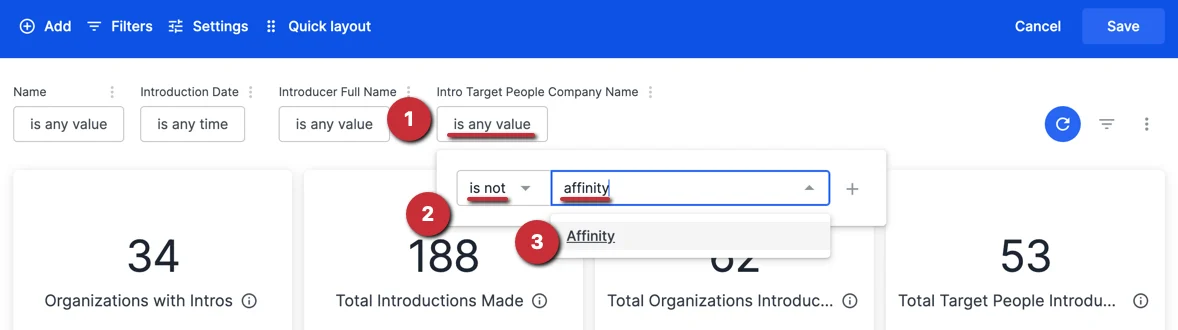
 6. You should now see the new filter created - click on it to change the operator from "is" to "is not" and type in to select your organization (e.g. Affinity). This will filter out all introductions made between your team members and externals at your portfolio company (e.g. Morgan Stanley), and only display introductions made between externals and externals at your portfolio company (e.g. Morgan Stanley).
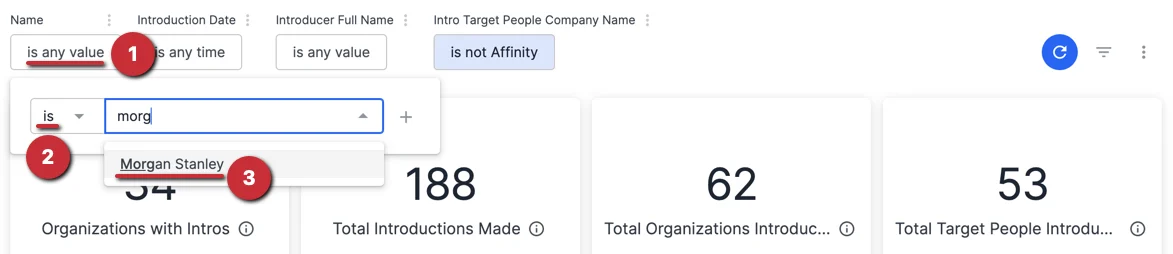
 7. **Optional**: If you'd like to narrow your focus, apply a filter to the **Name** field and select the specific organization(s) you'd like to focus on (e.g. Morgan Stanley).
 ## List of all new dimensions and measures
With the release of the **Introductions Summary Reports** template, we are also providing you with these new dimensions and measures to create your own custom visualizations if you'd like:
| **Dimensions** | **Measures** |
| -------------------------------- | ----------------------------- |
| Introduction Date | Count of Introductions |
| Introduction ID | Count of Intro Target People |
| Introducer Full Name | Count of Introducees |
| Introducee Full Name | Count of Introduced Companies |
| Intro Target People Full Name | |
| Intro Target People Company Name | |
| Intro Current Job Title\* | |
| Intro Job Titles\* | |
* "Intro Current Job Title" and "Intro Job Titles" are based on the **Target People**, not the **Introducer** or **Introducee**.
## Important Callouts
* To ensure that Affinity successfully counts your email interactions as introductions, see the section titled "**How does Affinity determine if an interaction is an introduction?**" in [How to track introductions in Affinity](/s/article/How-to-track-introductions-in-Affinity).
## Related topics
- [How To Track Introductions In Affinity](/s/article/How-to-track-introductions-in-Affinity.md)
- [Affinity Analytics List Summary Reports](/s/article/Affinity-Analytics-List-Summary-Reports.md)
- [Affinity Analytics Funnel Analysis Reports](/s/article/Affinity-Analytics-Funnel-Analysis-Reports.md)
- [Affinity Analytics Team Activity Reports](/s/article/Affinity-Analytics-Team-Activity-Reports.md)
- [Affinity Analytics - Status Reports for Investment Banking](/s/article/Affinity-Analytics-Status-Reports-for-Investment-Banking.md)
## List of all new dimensions and measures
With the release of the **Introductions Summary Reports** template, we are also providing you with these new dimensions and measures to create your own custom visualizations if you'd like:
| **Dimensions** | **Measures** |
| -------------------------------- | ----------------------------- |
| Introduction Date | Count of Introductions |
| Introduction ID | Count of Intro Target People |
| Introducer Full Name | Count of Introducees |
| Introducee Full Name | Count of Introduced Companies |
| Intro Target People Full Name | |
| Intro Target People Company Name | |
| Intro Current Job Title\* | |
| Intro Job Titles\* | |
* "Intro Current Job Title" and "Intro Job Titles" are based on the **Target People**, not the **Introducer** or **Introducee**.
## Important Callouts
* To ensure that Affinity successfully counts your email interactions as introductions, see the section titled "**How does Affinity determine if an interaction is an introduction?**" in [How to track introductions in Affinity](/s/article/How-to-track-introductions-in-Affinity).
## Related topics
- [How To Track Introductions In Affinity](/s/article/How-to-track-introductions-in-Affinity.md)
- [Affinity Analytics List Summary Reports](/s/article/Affinity-Analytics-List-Summary-Reports.md)
- [Affinity Analytics Funnel Analysis Reports](/s/article/Affinity-Analytics-Funnel-Analysis-Reports.md)
- [Affinity Analytics Team Activity Reports](/s/article/Affinity-Analytics-Team-Activity-Reports.md)
- [Affinity Analytics - Status Reports for Investment Banking](/s/article/Affinity-Analytics-Status-Reports-for-Investment-Banking.md)