> ## Documentation Index
> Fetch the complete documentation index at: https://support.affinity.co/llms.txt
> Use this file to discover all available pages before exploring further.
# Affinity Analytics Funnel Analysis Reports
> Help center reference
**Reference** — lookup information.
With Funnel Analysis Reports, you can quickly understand how your deals progress over time. You can also track the average amount of time spent on each stage of the pipeline to determine areas where you/your team can improve on time spent.
**Note**: This video contains the old navigation bar on the top, whereas the current navigation bar now lies on the left side of your screen. While the remaining content is still the same, rest assured that we will be updating our videos accordingly.
## Get started with the Funnel Analysis template
Get started by using the **Funnel Analysis** template provided by Affinity:
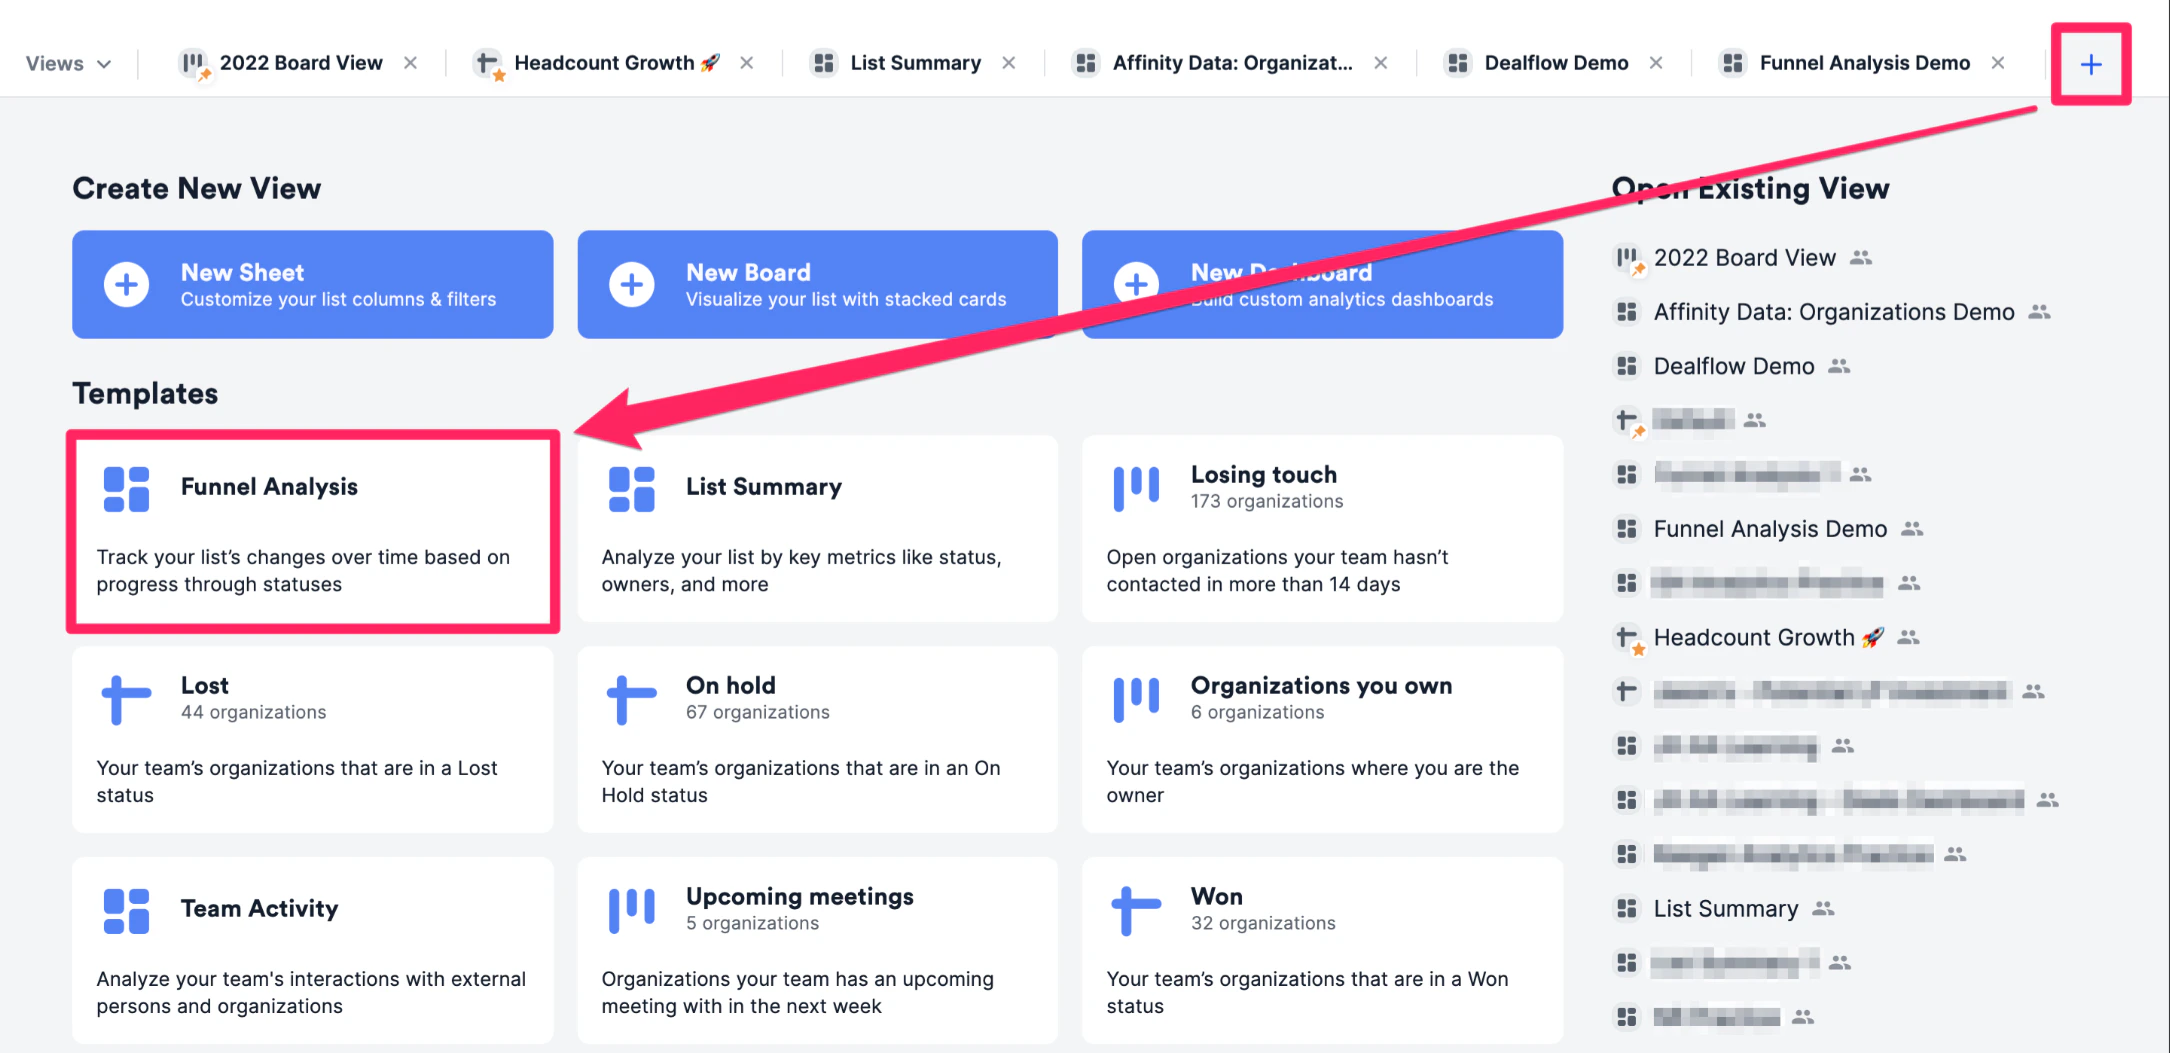
1. First, click on the list you'd like to report on, then click the **+** icon as shown below. Then, click the **Funnel Analysis** template option to create a new dashboard view.
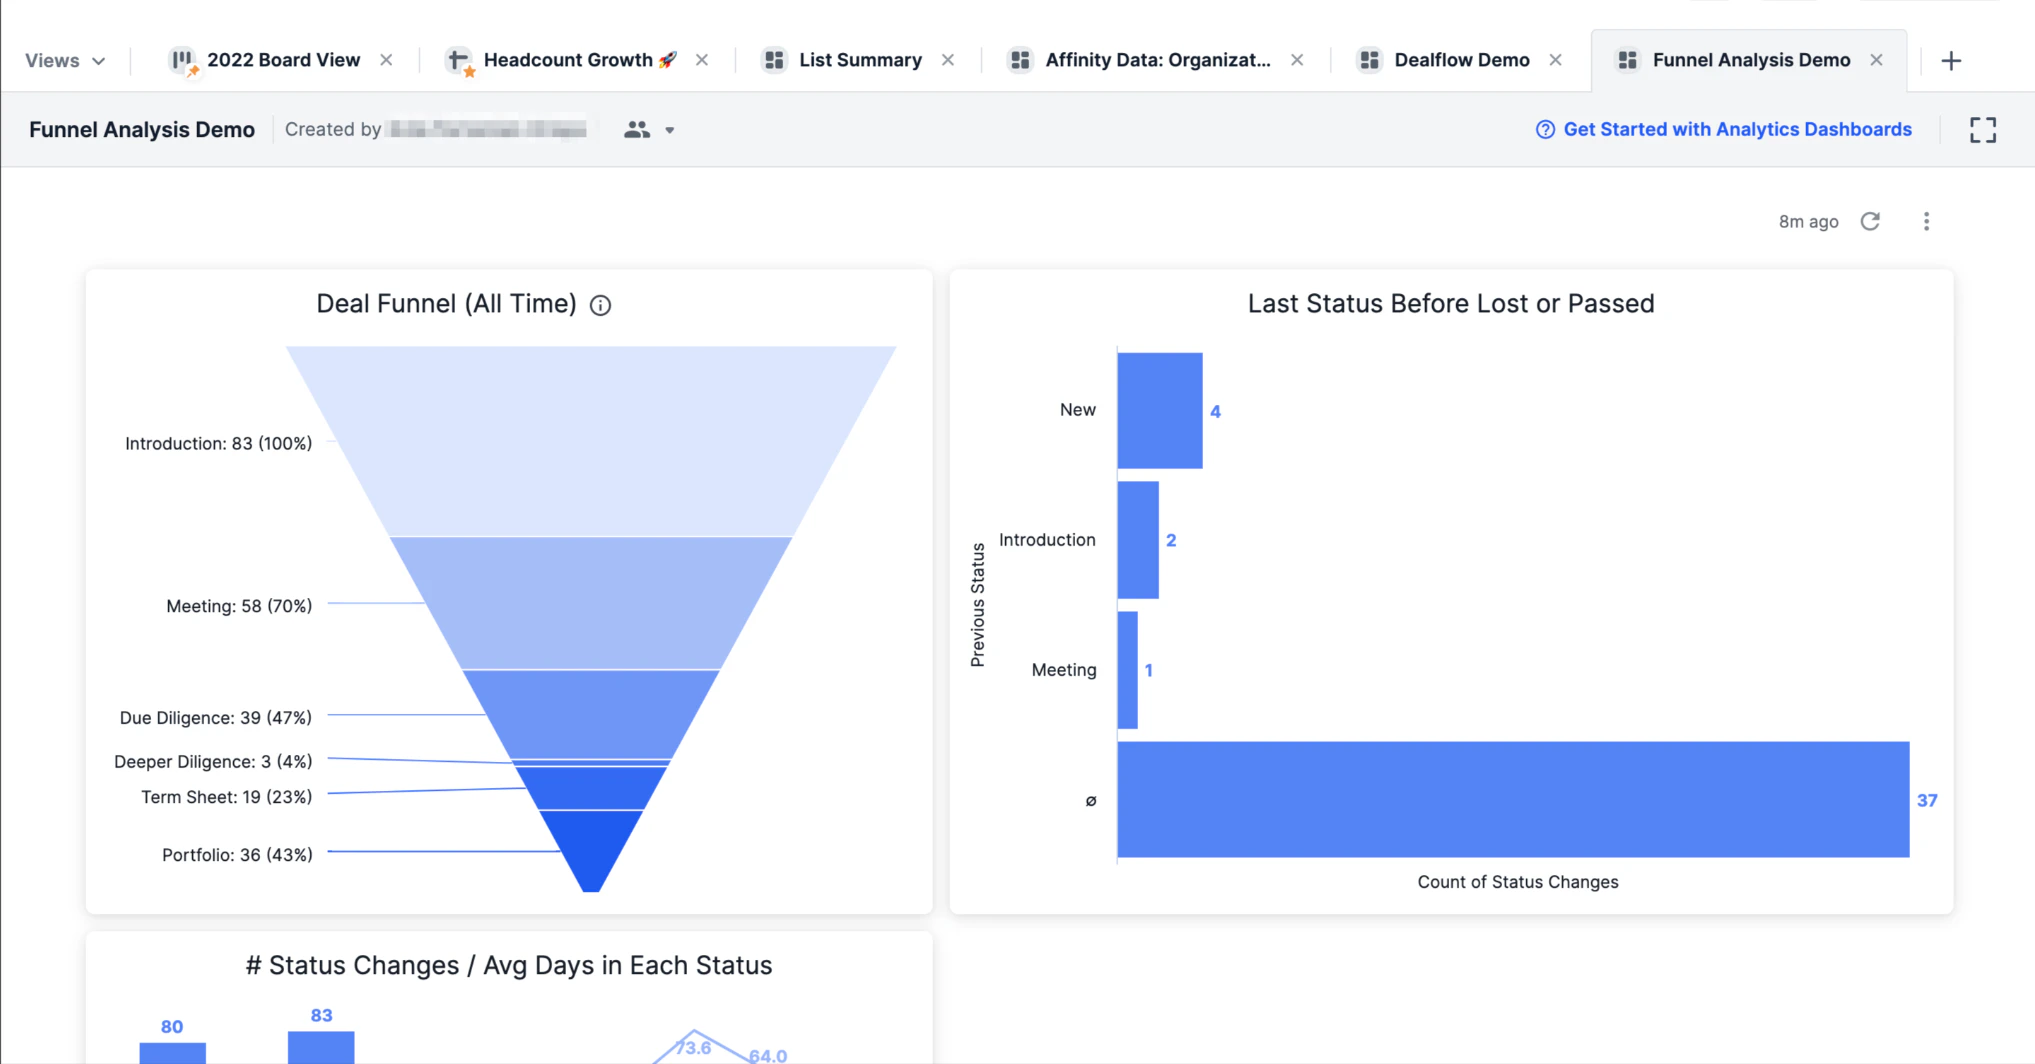
 2. Once the **Funnel Analysis** report is generated, you will immediately see different visualization tiles and metrics based on the data within this list.
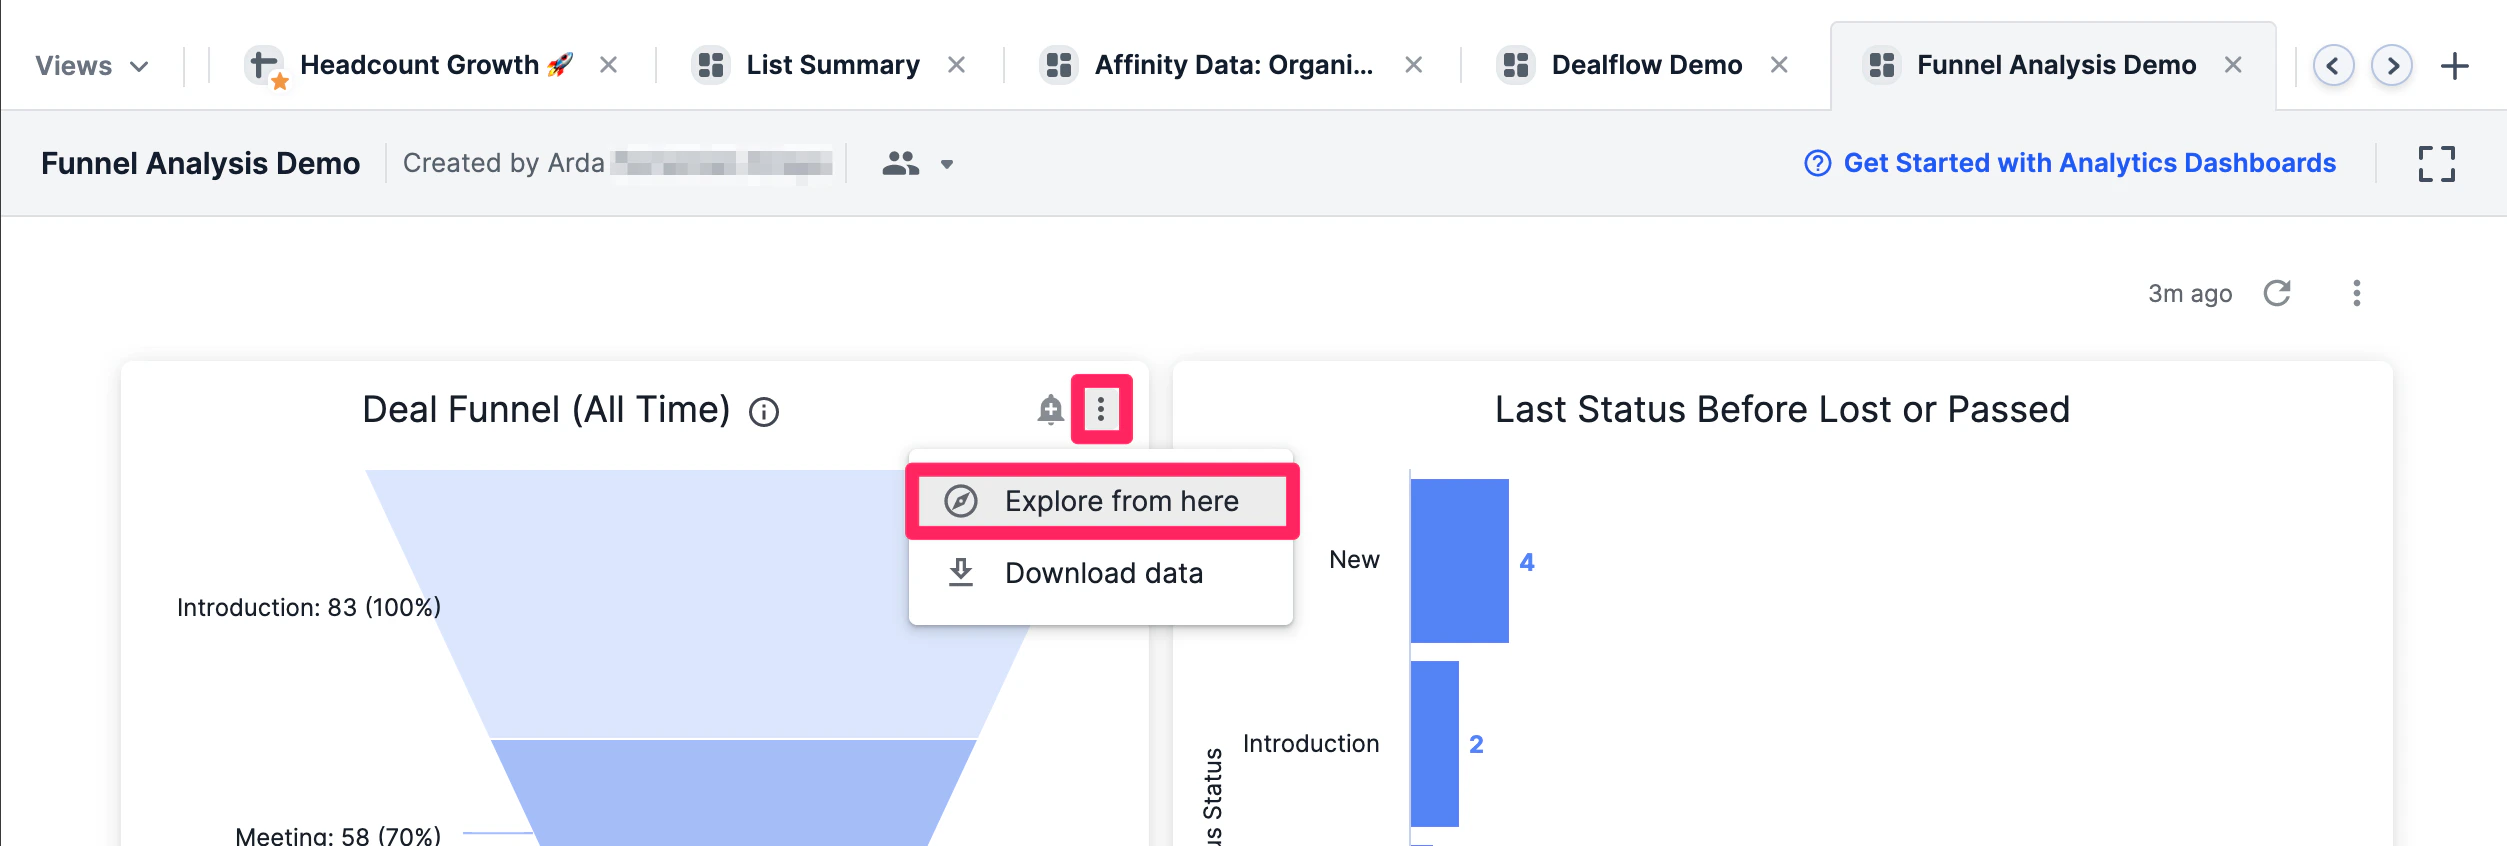
 3. Want to understand how certain visualization tiles were generated? Click the ellipsis (3-dotted icon) on the top-right corner of the visualization tile you want to dig deeper into, then click **Explore from here**.
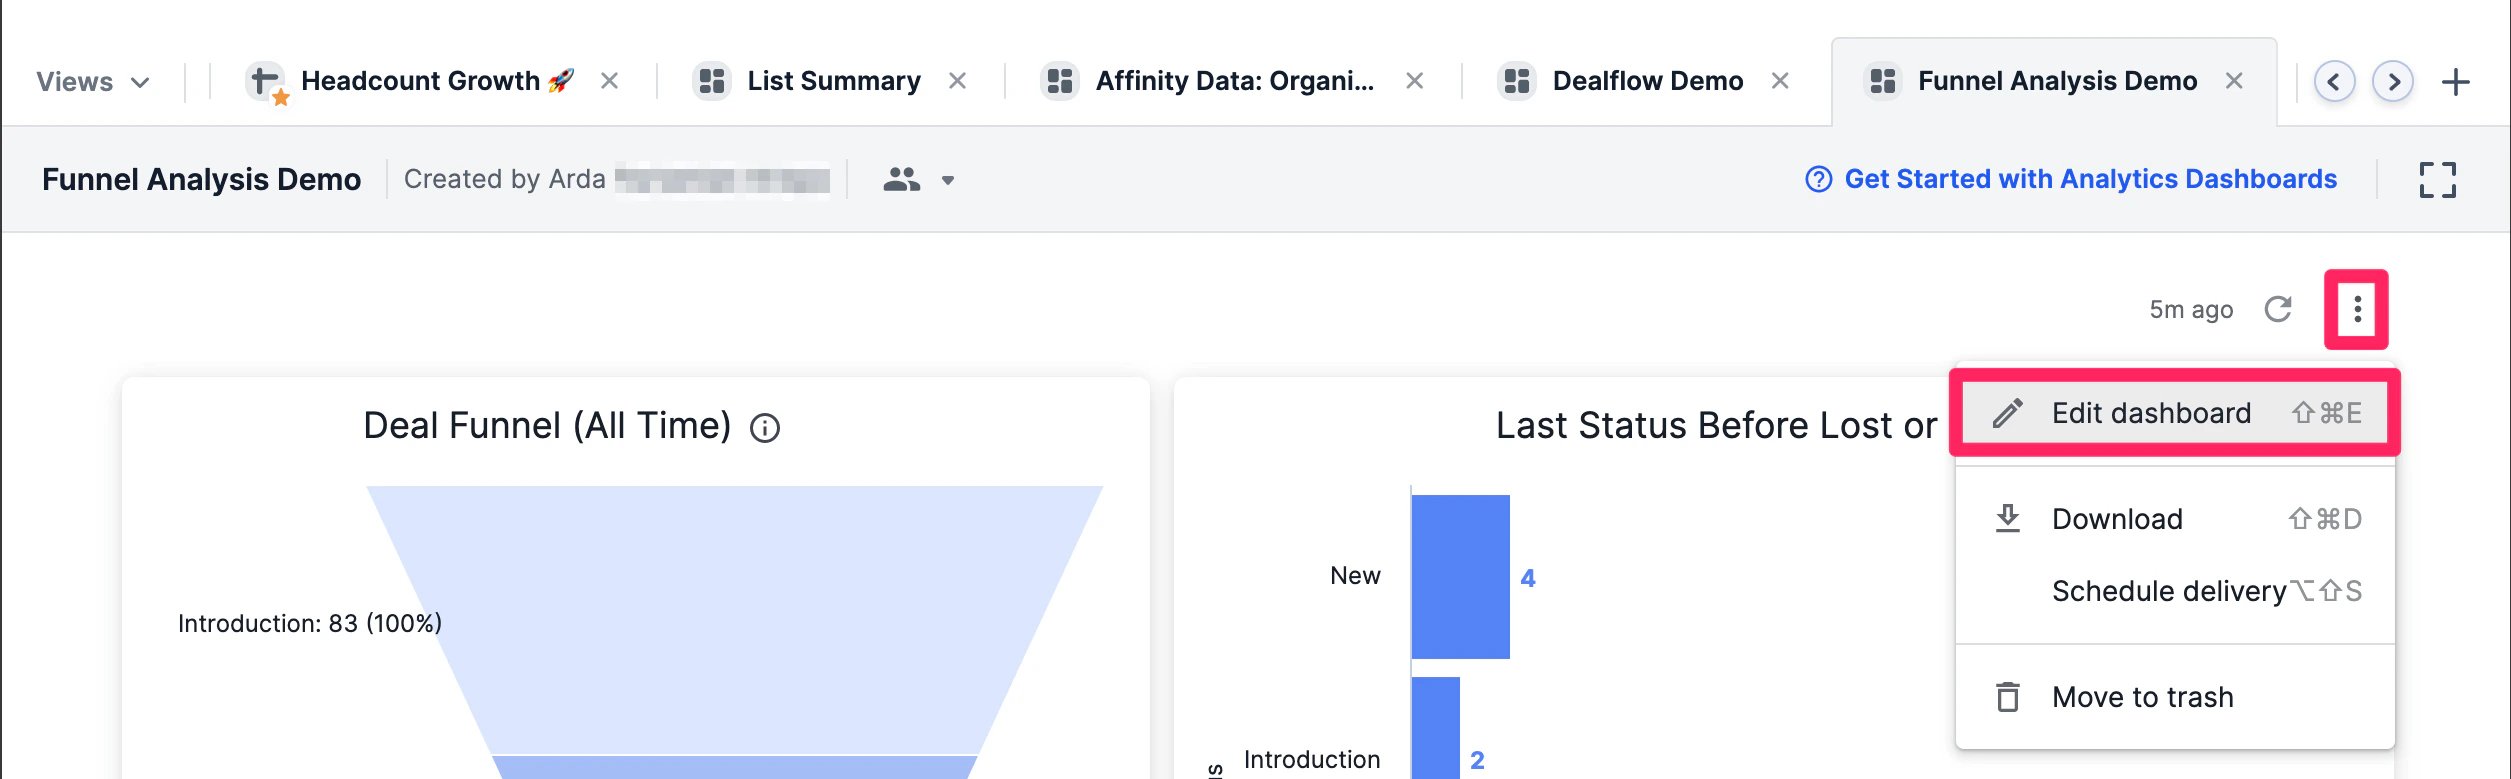
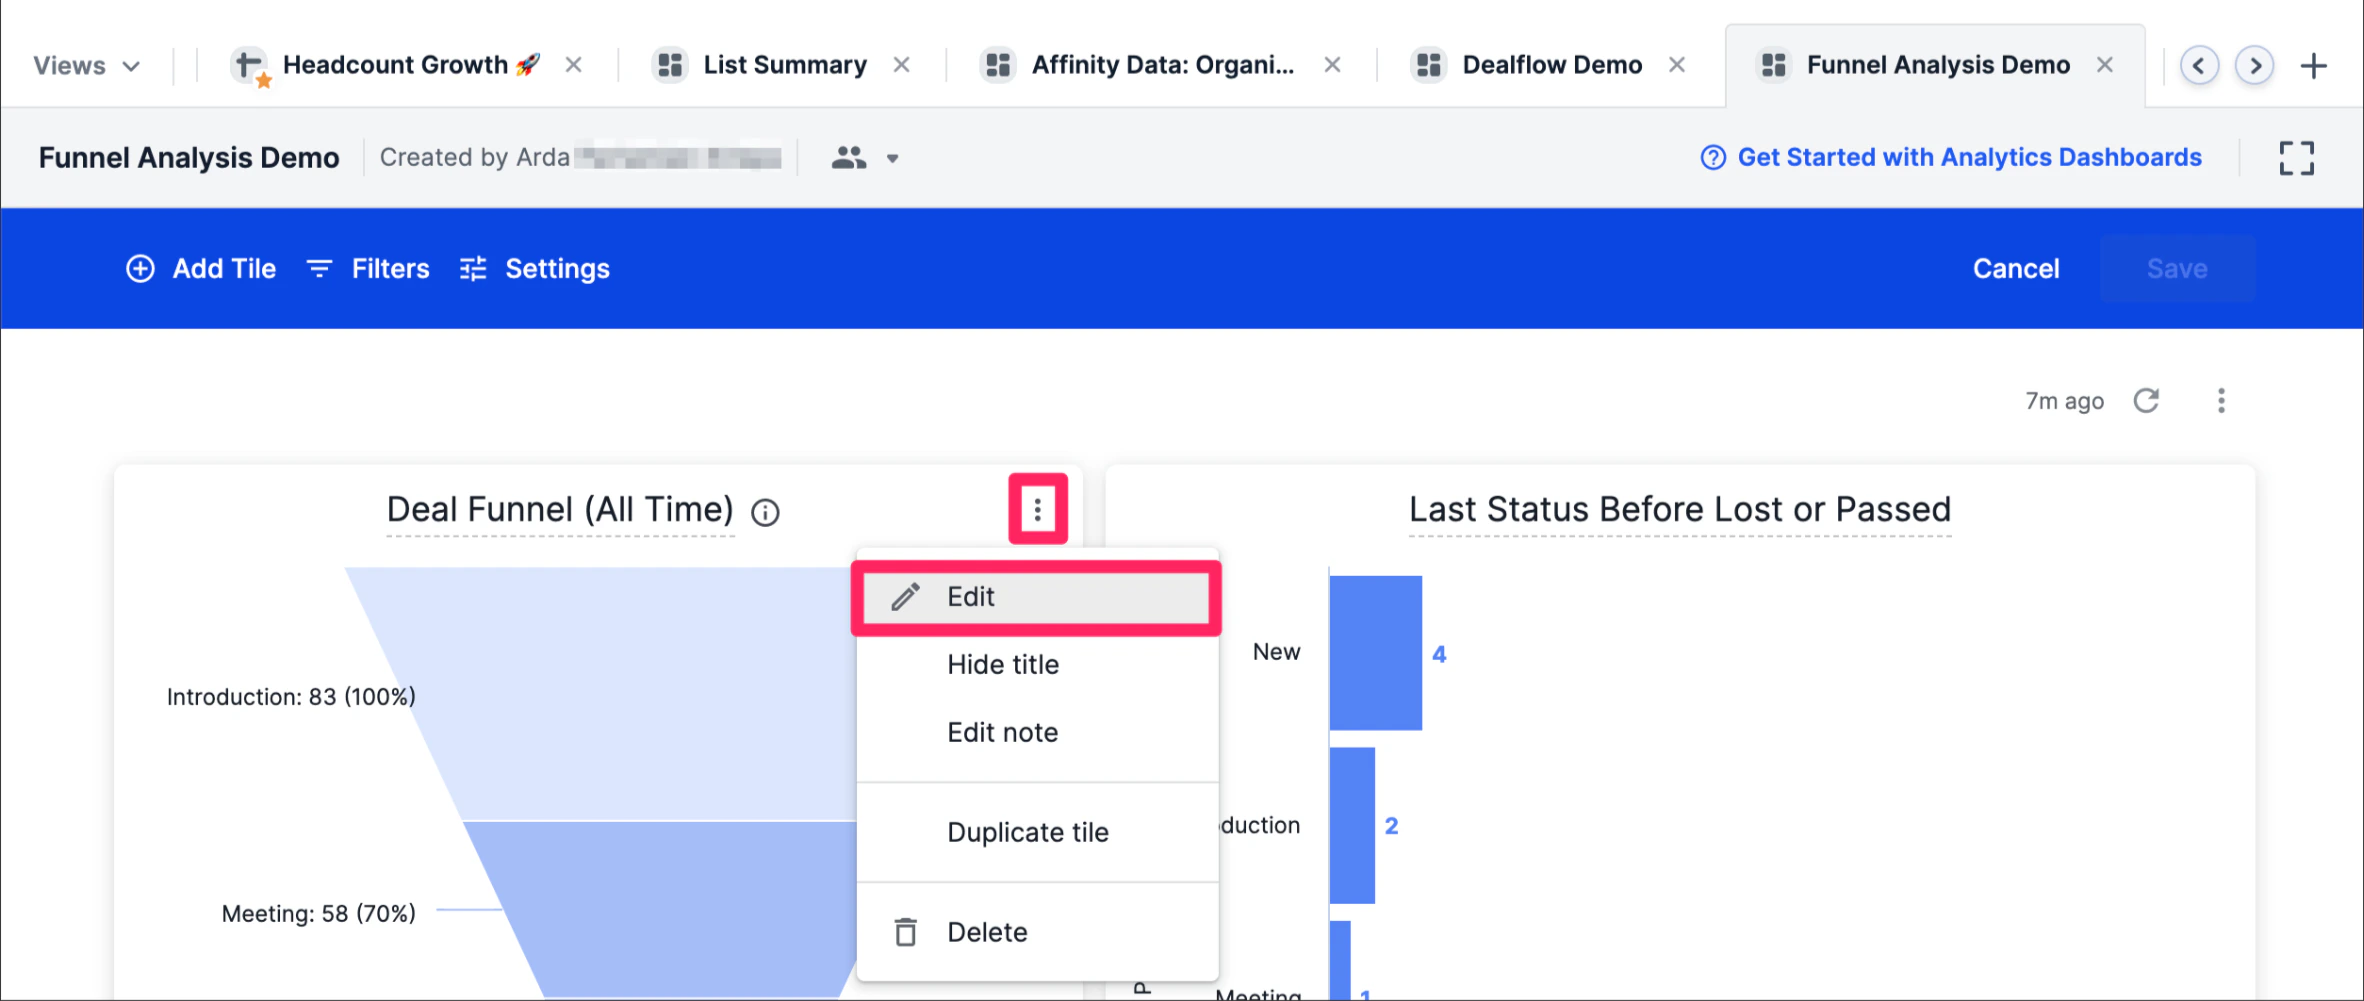
 4. If you'd like to change the data fields being used for certain visualization tiles, click the ellipsis (3-dotted icon) on the top-right corner, then click **Edit dashboard**.
 5. Then, click the ellipsis (3-dotted icon) on the top-right corner of the visualization tile you want to dig deeper into, then click **Edit**.
 ## Important Callouts
* If you notice a funnel with percentages that don't get smaller and smaller as you go down the funnel, it may be that some of the status options have a higher count than others (e.g. On Hold, Passed, Lost, etc.).
* The percentages for all status options, in this case, are based on dividing their count from the status option with the highest count, regardless of its place within the overall progression of the funnel.
* To learn more about customizing, filtering, and pivoting data on your dashboard view, check out the following articles to take your skills to the next level:
* [How to create a dashboard view](/s/article/How-to-create-a-dashboard-view)
* [How to create custom groups in dashboard views](/s/article/How-to-create-custom-groups-in-dashboard-views)
* [How to apply filters in dashboard views](/s/article/How-to-apply-filters-in-dashboard-views)
* [How to pivot data on your dashboard views](/s/article/How-to-pivot-data-on-your-dashboard-views)
## Important Callouts
* If you notice a funnel with percentages that don't get smaller and smaller as you go down the funnel, it may be that some of the status options have a higher count than others (e.g. On Hold, Passed, Lost, etc.).
* The percentages for all status options, in this case, are based on dividing their count from the status option with the highest count, regardless of its place within the overall progression of the funnel.
* To learn more about customizing, filtering, and pivoting data on your dashboard view, check out the following articles to take your skills to the next level:
* [How to create a dashboard view](/s/article/How-to-create-a-dashboard-view)
* [How to create custom groups in dashboard views](/s/article/How-to-create-custom-groups-in-dashboard-views)
* [How to apply filters in dashboard views](/s/article/How-to-apply-filters-in-dashboard-views)
* [How to pivot data on your dashboard views](/s/article/How-to-pivot-data-on-your-dashboard-views)